Categories: Technical analysis

NZDCHF Wave Analysis 27 January, 2021

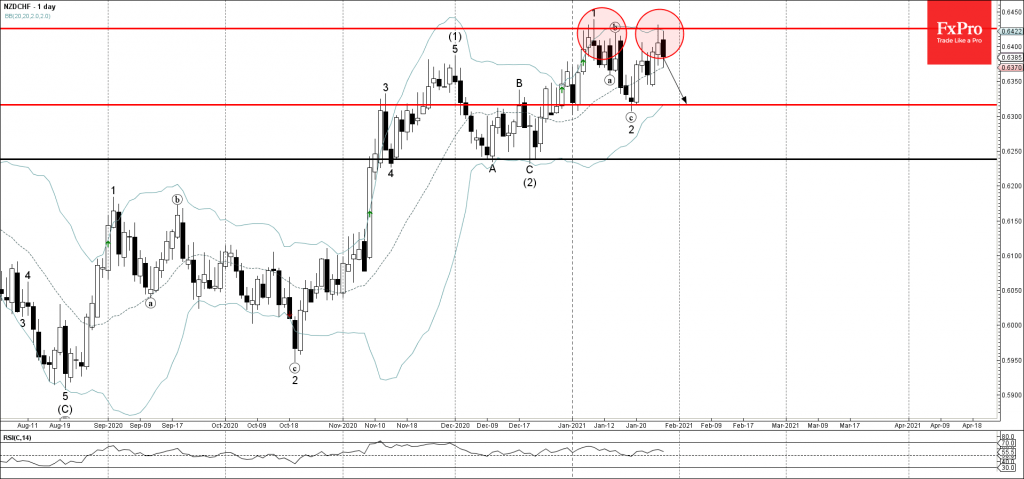
• NZDCHF reversed from resistance level 0.6420

• Likely to fall to support level 0.6315

NZDCHF recently reversed down from the resistance level 0.6420 (which has been reversing this currency pair from the start of June, as can be seen below) – intersecting with the upper daily Bollinger Band.

The downward reversal from the resistance level stopped the previous short-term impulse wave 3 from the middle of January.

Given the weakening bullish pressure on this currency pair – as is revealed buy the falling RSI indicator – NZDCHF is expected to fall further toward the next support level 0.6315.

The FxPro Tech Analysis Team

The FxPro technical experts prepare a daily analysis of the most active currency pairs (majors, crosses, exotics) and commodities. Selected instruments are reviewed on daily trends (D1, H4), using the active Elliott Wave setups, Japanese candlesticks, indicators, and support/resistance levels.

Share
Published by
The FxPro Tech Analysis Team
Tags: NZDCHF

Recent Posts

AUDJPY Wave Analysis – 5 December 2025

AUDJPY: ⬆️ Buy - AUDJPY broke long-term resistance level 102.30 - Likely to rise to…

5 hours ago

Aptos Wave Analysis – 5 December 2025

Aptos: ⬇️ Sell - Aptos testing major support at 1.688 - Likely to fall to…

5 hours ago

Pro News Weekly: Market Shake-Up, Dollar Drops, Gold Surges, Bitcoin Wobbles!

Welcome to Pro News Flash! 💵 The U.S. dollar slips 🏆 Major stock indices struggle…

11 hours ago

Solana Wave Analysis – 5 December 2025

Solana: ⬇️ Sell - Solana reversed from resistance zone - Likely to fall to support…

12 hours ago

EURAUD Wave Analysis – 5 December 2025

EURAUD : ⬇️ Sell - EURAUD broke the support level 1.7600 - Likely to fall…

12 hours ago

Forex has set its priorities

In 2026, experts favour the yen, see modest euro growth, and expect pressure on the…

16 hours ago

This website uses cookies