Categories: Technical analysis

NZDCHF Wave Analysis 24 February, 2021

• NZDCHF under the strong bullish pressure

• Likely to reach resistance 0.6800

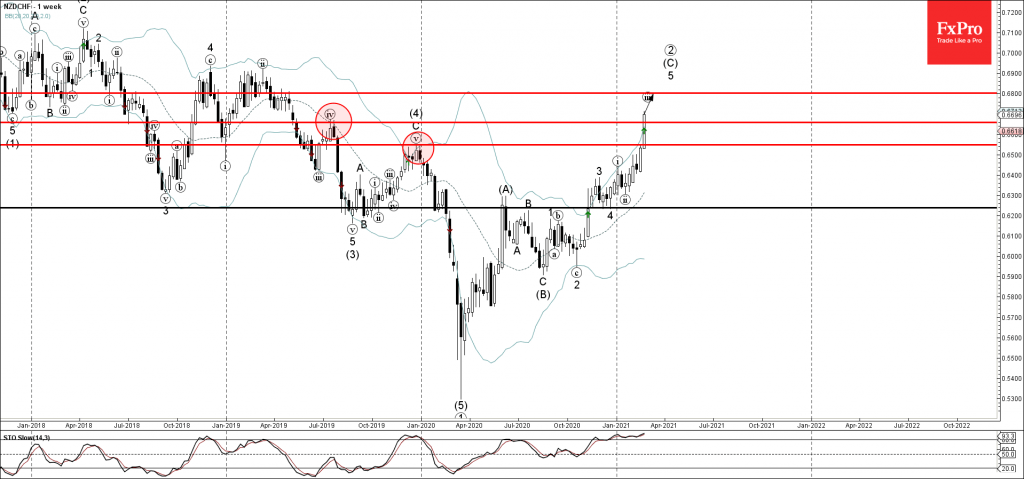
NZDCHF under the strong bullish pressure after the active impulse wave 5 broke above the major resistance level 0.6660 (former multi-month high from the middle of 2019).

The breakout of the resistance level 0.6660 continues the active weekly upward impulse sequence (C) from the middle of 2020

NZDCHF is likely to rise further toward the next resistance level 0.6800 (target price for the completion of the active minor impulse wave (iii)).

The FxPro Tech Analysis Team

The FxPro technical experts prepare a daily analysis of the most active currency pairs (majors, crosses, exotics) and commodities. Selected instruments are reviewed on daily trends (D1, H4), using the active Elliott Wave setups, Japanese candlesticks, indicators, and support/resistance levels.

Share
Published by
The FxPro Tech Analysis Team
Tags: NZDCHF

Recent Posts

Bitcoin Wave Analysis – 14 January 2026

Bitcoin: ⬆️ Buy - Bitcoin broke resistance area - Likely to rise to resistance level…

12 hours ago

NZDJPY Wave Analysis – 14 January 2026

NZDJPY: ⬇️ Sell - NZDJPY reversed down from the resistance area - Likely to fall…

12 hours ago

What is Leverage?

Leverage is a mechanism that lets traders control larger positions using smaller capital. By choosing…

17 hours ago

The dollar does not tolerate dissent

US GDP growth is driven not by the White House, but by AI. The Bank…

22 hours ago

The crypto market has made a breakthrough

The crypto market surges, hitting new highs, with bullish sentiment for Bitcoin and Ethereum amid…

23 hours ago

Brent Crude oil Wave Analysis – 13 January 2026

Brent Crude oil ⬆️ Buy - Brent Crude oil rising inside impulse wave c -…

2 days ago

This website uses cookies