Categories: Technical analysis

NZDCHF Wave Analysis 21 September, 2020

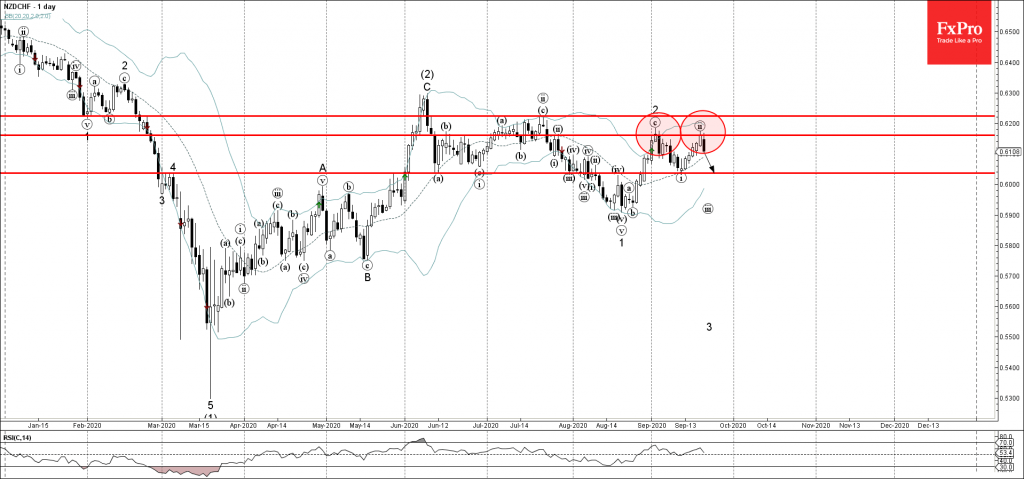
• NZDCHF reversed from resistance area

• Likely to fall to 0.6035

NZDCHF recently reversed down from the resistance zone located between the resistance level 0.6160 (top of the previous wave 2) and the upper daily Bollinger Band.

The downward reversal from this resistance area stopped the previous short-term corrective wave (ii).

Given the bullish CHF sentiment seen today – NZDCHF is likely to fall further toward the next support level 0.6035 (low of the previous Morning Star and wave (i)).

AddThis Website Tools
The FxPro Tech Analysis Team

The FxPro technical experts prepare a daily analysis of the most active currency pairs (majors, crosses, exotics) and commodities. Selected instruments are reviewed on daily trends (D1, H4), using the active Elliott Wave setups, Japanese candlesticks, indicators, and support/resistance levels.

Share
Published by
The FxPro Tech Analysis Team
Tags: NZDCHF

Recent Posts

NIO Wave Analysis – 31 March 2025

NIO: ⬆️ Buy - NIO reversed from support zone - Likely to rise to resistance…

7 hours ago

Nvidia Wave Analysis – 31 March 2025

Nvidia: ⬆️ Buy - Nvidia reversed from key support level 105.00 - Likely to rise…

7 hours ago

Markets rattled on consumer sentiment

Consumer sentiment index from the University of Michigan shows alarming information for stock indices, with…

14 hours ago

EURAUD Wave Analysis – 31 March 2025

EURAUD: ⬆️ Buy - EURAUD rising inside impulse wave iii - Likely to reach resistance…

14 hours ago

USDCAD Wave Analysis – 31 March 2025

USDCAD: ⬆️ Buy - USDCAD reversed from the support zone - Likely to rise to…

14 hours ago

Video Pro News Weekly: Market Shake-Up. USD Struggles & Crypto’s Next Big Move!

Major market shifts underway! The US dollar hits resistance, stocks teeter on tariff tensions, and…

19 hours ago