Categories: Technical analysis

NZDCHF Wave Analysis 20 October, 2020

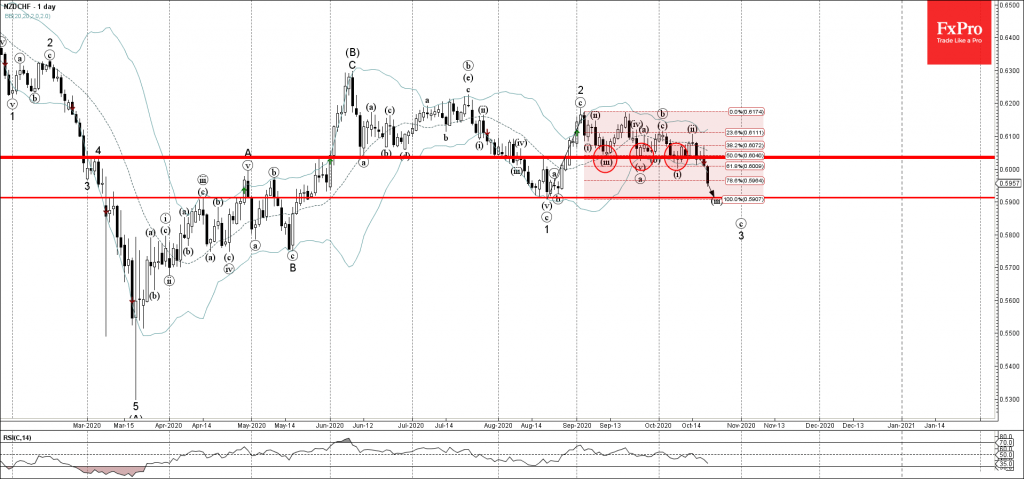
• NZDCHF  broke support area

• Likely to fall to 0.5900

NZDCHF recently broke sharply below the support area lying between the key support level 0.6010 (which stopped the previous short-term wave (a)) and the 50% Fibonacci retracement of the upward correction 2 from August.

The breakout of this support area accelerated the active short-term impulse waves 3 and (iii).

NZDCHF is likely to fall further toward the next support level 0.5900 (forecast price for the completion of the active minor impulse wave (iii)).

The FxPro Tech Analysis Team

The FxPro technical experts prepare a daily analysis of the most active currency pairs (majors, crosses, exotics) and commodities. Selected instruments are reviewed on daily trends (D1, H4), using the active Elliott Wave setups, Japanese candlesticks, indicators, and support/resistance levels.

Share
Published by
The FxPro Tech Analysis Team
Tags: NZDCHF

Recent Posts

EURJPY Wave Analysis 2 May 2024

- EURJPY under strong bearish pressure - Likely to fall to support level 163.10 EURJPY…

5 hours ago

WTI crude oil Wave Analysis 2 May 2024

- WTI broke round support level 80.00 - Likely to fall to support level 76.00…

5 hours ago

ADP hints at another strong NFP on Friday

The monthly ADP labour market report showed that America created 192K new jobs in April, above…

1 day ago

Fed’s hawkish tone risks sinking S&P500 to 4700

Bears showed strength ahead of the FOMC decision.  U.S. indices sagged on Tuesday as investors…

2 days ago

A new stage of Bitcoin’s decline

Market Picture  Bitcoin's closing price on Tuesday became the lowest since late February, confirming the…

2 days ago

Ebay Wave Analysis 30 April 2024

- Ebay under the bearish pressure - Likely to fall to support level 51.00 Ebay…

2 days ago

This website uses cookies