Categories: Technical analysis

NZDCHF Wave Analysis 19 February, 2021

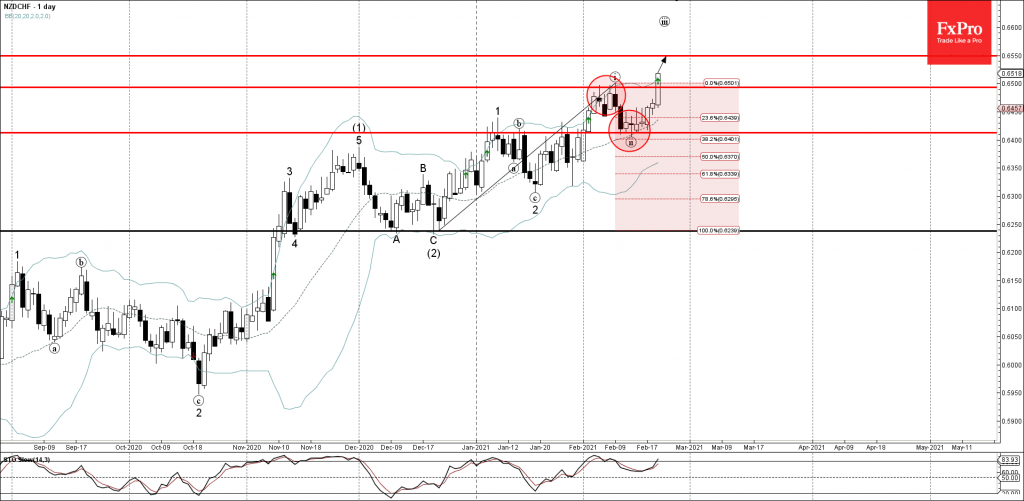
• NZDCHF broke resistance level 0.6500

• Likely to reach resistance level 0.6550

NZDCHF rose sharply today – on improved risk sentiment (which is driving Swiss franc sales) – above the resistance level 0.6500 (top of the previous impulse wave (i)).

The breakout of the resistance level 0.6500 should be followed with the daily close above this price level – for the predominant uptrend to continue.

If the pair closes above the resistance level 0.6500 – NZDCHF can then be expected to rise further toward the next resistance level 0.6550.

The FxPro Tech Analysis Team

The FxPro technical experts prepare a daily analysis of the most active currency pairs (majors, crosses, exotics) and commodities. Selected instruments are reviewed on daily trends (D1, H4), using the active Elliott Wave setups, Japanese candlesticks, indicators, and support/resistance levels.

Share
Published by
The FxPro Tech Analysis Team
Tags: NZDCHF

Recent Posts

Markets pick up signals from the White House

Donald Trump has no intention of dismissing Jerome Powell. The White House's decision to postpone…

7 minutes ago

Bitcoin aims to break out of a corrective rebound

Crypto market rebounds, Bitcoin eyes $100K, Dash surges, institutional demand rises, and Ethereum staking hits…

32 minutes ago

Bitcoin Wave Analysis – 14 January 2026

Bitcoin: ⬆️ Buy - Bitcoin broke resistance area - Likely to rise to resistance level…

15 hours ago

NZDJPY Wave Analysis – 14 January 2026

NZDJPY: ⬇️ Sell - NZDJPY reversed down from the resistance area - Likely to fall…

15 hours ago

What is Leverage?

Leverage is a mechanism that lets traders control larger positions using smaller capital. By choosing…

20 hours ago

The dollar does not tolerate dissent

US GDP growth is driven not by the White House, but by AI. The Bank…

1 day ago

This website uses cookies