Categories: Technical analysis

NZDCHF Wave Analysis – 13 May, 2020

• NZDCHF udder bearish pressure

• Likely to fall to 0.5800

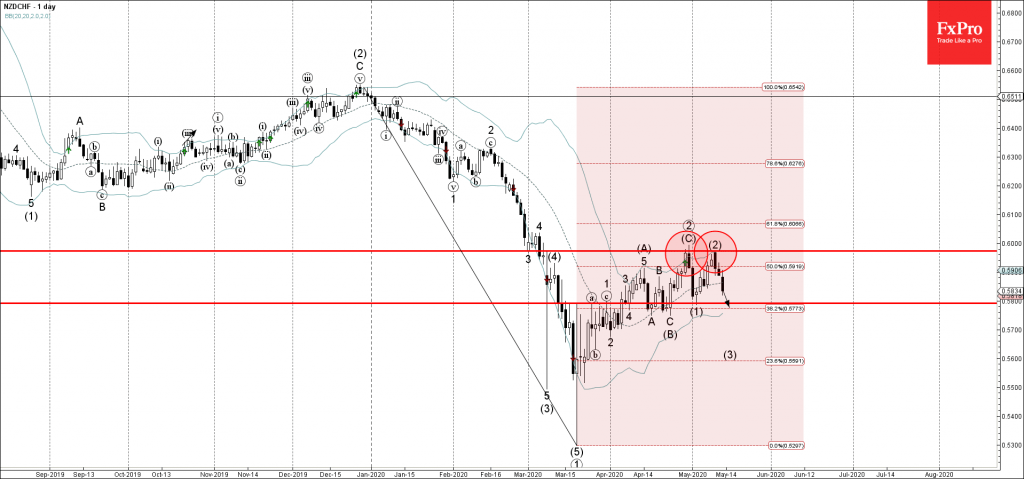
NZDCHF udder bearish pressure after the earlier downward reversal from the resistance area lying between the resistance level 0.5970, upper daily Bollinger Band and the 50% Fibonacci correction of the previous downward impulse from December.

The downward reversal from this resistance area started the active medium-term downward impulse wave (3).

NZDCHF is expected to fall further toward the next support level 0.5800 (which stopped the previous impulse wave (1)).

AddThis Website Tools
The FxPro Tech Analysis Team

The FxPro technical experts prepare a daily analysis of the most active currency pairs (majors, crosses, exotics) and commodities. Selected instruments are reviewed on daily trends (D1, H4), using the active Elliott Wave setups, Japanese candlesticks, indicators, and support/resistance levels.

Share
Published by
The FxPro Tech Analysis Team
Tags: NZDCHF

Recent Posts

AMD Wave Analysis – 28 March 2025

AMD: ⬇️ Sell - AMD reversed from pivotal resistance level 115.00 - Likely to fall…

13 hours ago

Google Wave Analysis – 28 March 2025

Google: ⬇️ Sell - Google broke key support level 160.00 - Likely to fall to…

13 hours ago

Gold Wave Analysis – 28 March 2025

Gold: ⬆️ Buy - Gold broke resistance level 3050.00 - Likely to rise to resistance…

13 hours ago

Ethereum Wave Analysis – 28 March 2025

Ethereum: ⬇️ Sell - Ethereum reversed from the resistance level 2120.00 - Likely to fall…

13 hours ago

US inflation accelerates but lags income growth

US PCE inflation exceeded expectations at 2.8% in February. Income growth and savings rates remain…

18 hours ago

What is next: Australia Rate, EU CPI, US NFP

Europe will switch to daylight saving time next week. Key events include the RBA's rate…

20 hours ago