Categories: Technical analysis

NZDCHF Wave Analysis – 12 May 2023

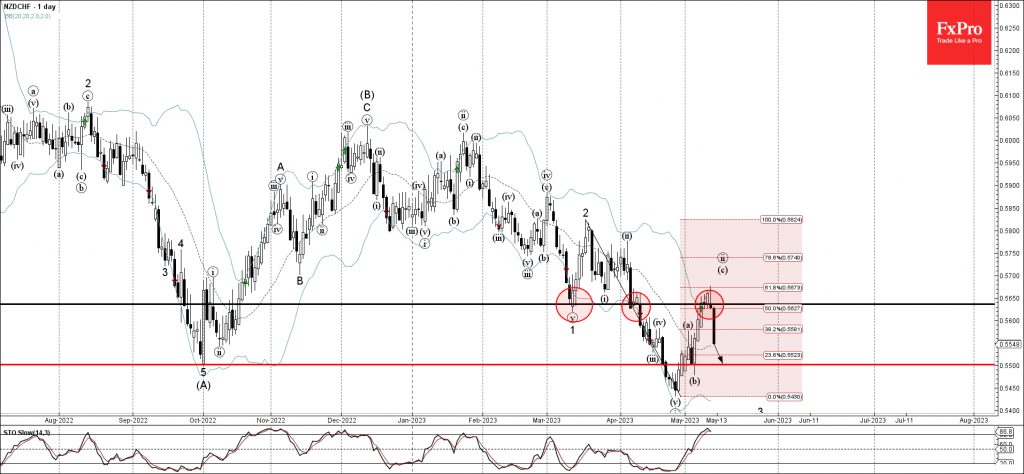
• NZDCHF reversed from resistance level 0.5635

• Likely to fall to support level 0.5500

NZDCHF currency pair recently reversed down from the key resistance level 0.5635 (former strong support from the start of March), intersecting with the upper daily Bollinger Band.

The downward reversal from the resistance level 0.5635 created the daily candlesticks reversal pattern Shooting Star.

Given the strong daily downtrend, NZDCHF can be expected to fall toward the next support level 0.5500.

The FxPro Tech Analysis Team

The FxPro technical experts prepare a daily analysis of the most active currency pairs (majors, crosses, exotics) and commodities. Selected instruments are reviewed on daily trends (D1, H4), using the active Elliott Wave setups, Japanese candlesticks, indicators, and support/resistance levels.

Share
Published by
The FxPro Tech Analysis Team
Tags: NZDCHF

Recent Posts

Bitcoin’s Downtrend, Solana and Ethereum Form Double Bottom

Market picture  Crypto market capitalisation rose 3.3% in 24 hours to $2.22 trillion. Local capitalisation…

45 mins ago

EURJPY Wave Analysis 2 May 2024

- EURJPY under strong bearish pressure - Likely to fall to support level 163.10 EURJPY…

14 hours ago

WTI crude oil Wave Analysis 2 May 2024

- WTI broke round support level 80.00 - Likely to fall to support level 76.00…

14 hours ago

ADP hints at another strong NFP on Friday

The monthly ADP labour market report showed that America created 192K new jobs in April, above…

2 days ago

Fed’s hawkish tone risks sinking S&P500 to 4700

Bears showed strength ahead of the FOMC decision.  U.S. indices sagged on Tuesday as investors…

2 days ago

A new stage of Bitcoin’s decline

Market Picture  Bitcoin's closing price on Tuesday became the lowest since late February, confirming the…

2 days ago

This website uses cookies