Categories: Technical analysis

NZDCHF Wave Analysis 11 December, 2020

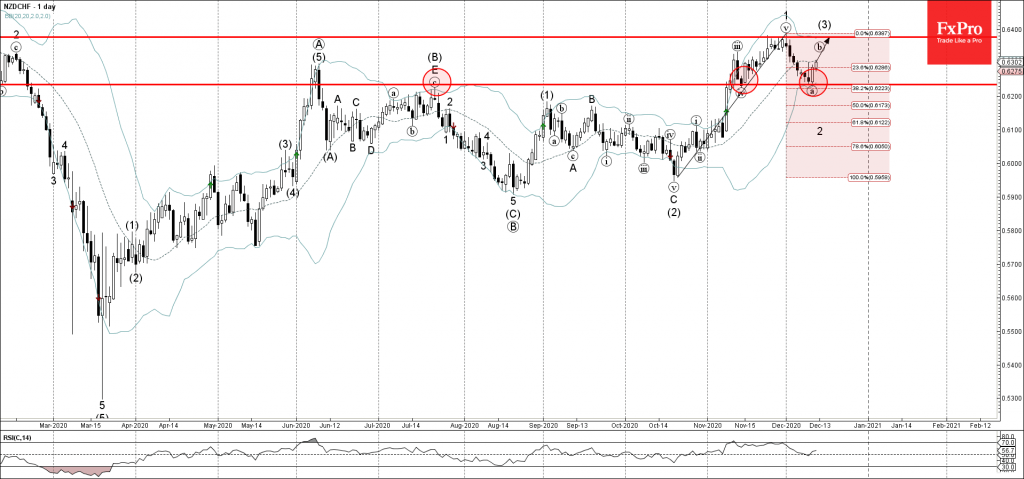
• NZDCHF rising inside wave (b))

• Likely to test resistance level 0.6375

NZDCHF recently reversed up from the key support level 0.6235 (former low of wave (iv) from November) – standing close to the lower daily Bollinger Band and 38.2% Fibonacci correction of the upward impulse 1 from October.

The upward reversal from the support level 0.6235 started the active short-term correction (b). NZDCHF is expected to rise further toward the next resistance level 0.6375 (top of the previous impulse wave 1 and the target for the completion of the active wave (b)).

The FxPro Tech Analysis Team

The FxPro technical experts prepare a daily analysis of the most active currency pairs (majors, crosses, exotics) and commodities. Selected instruments are reviewed on daily trends (D1, H4), using the active Elliott Wave setups, Japanese candlesticks, indicators, and support/resistance levels.

Share
Published by
The FxPro Tech Analysis Team
Tags: NZDCHF

Recent Posts

Baidu Wave Analysis – 11 April 2025

Baidu: ⬆️ Buy - Baidu reversed from support zone - Likely to rise to resistance level…

2 days ago

USDCAD Wave Analysis – 11 April 2025

USDCAD: ⬇️ Sell - USDCAD broke support zone - Likely to fall to support level…

2 days ago

Video: Massive Market Reversal or Total Collapse? The Charts Are Screaming…

We break down one of the most dramatic weeks in the markets — including a…

3 days ago

US Dollar Suffers Amidst Inflation Data and Expectations

The US dollar is suffering due to weaker than expected inflation data and a surge…

3 days ago

USDJPY Wave Analysis – 11 April 2025

USDJPY: ⬇️ Sell - USDJPY broke the support zone - Likely to fall to support…

3 days ago

Bitcoin Wave Analysis – 11 April 2025

Bitcoin: ⬆️ Buy - Bitcoin reversed from support zone - Likely to rise to resistance…

3 days ago

This website uses cookies