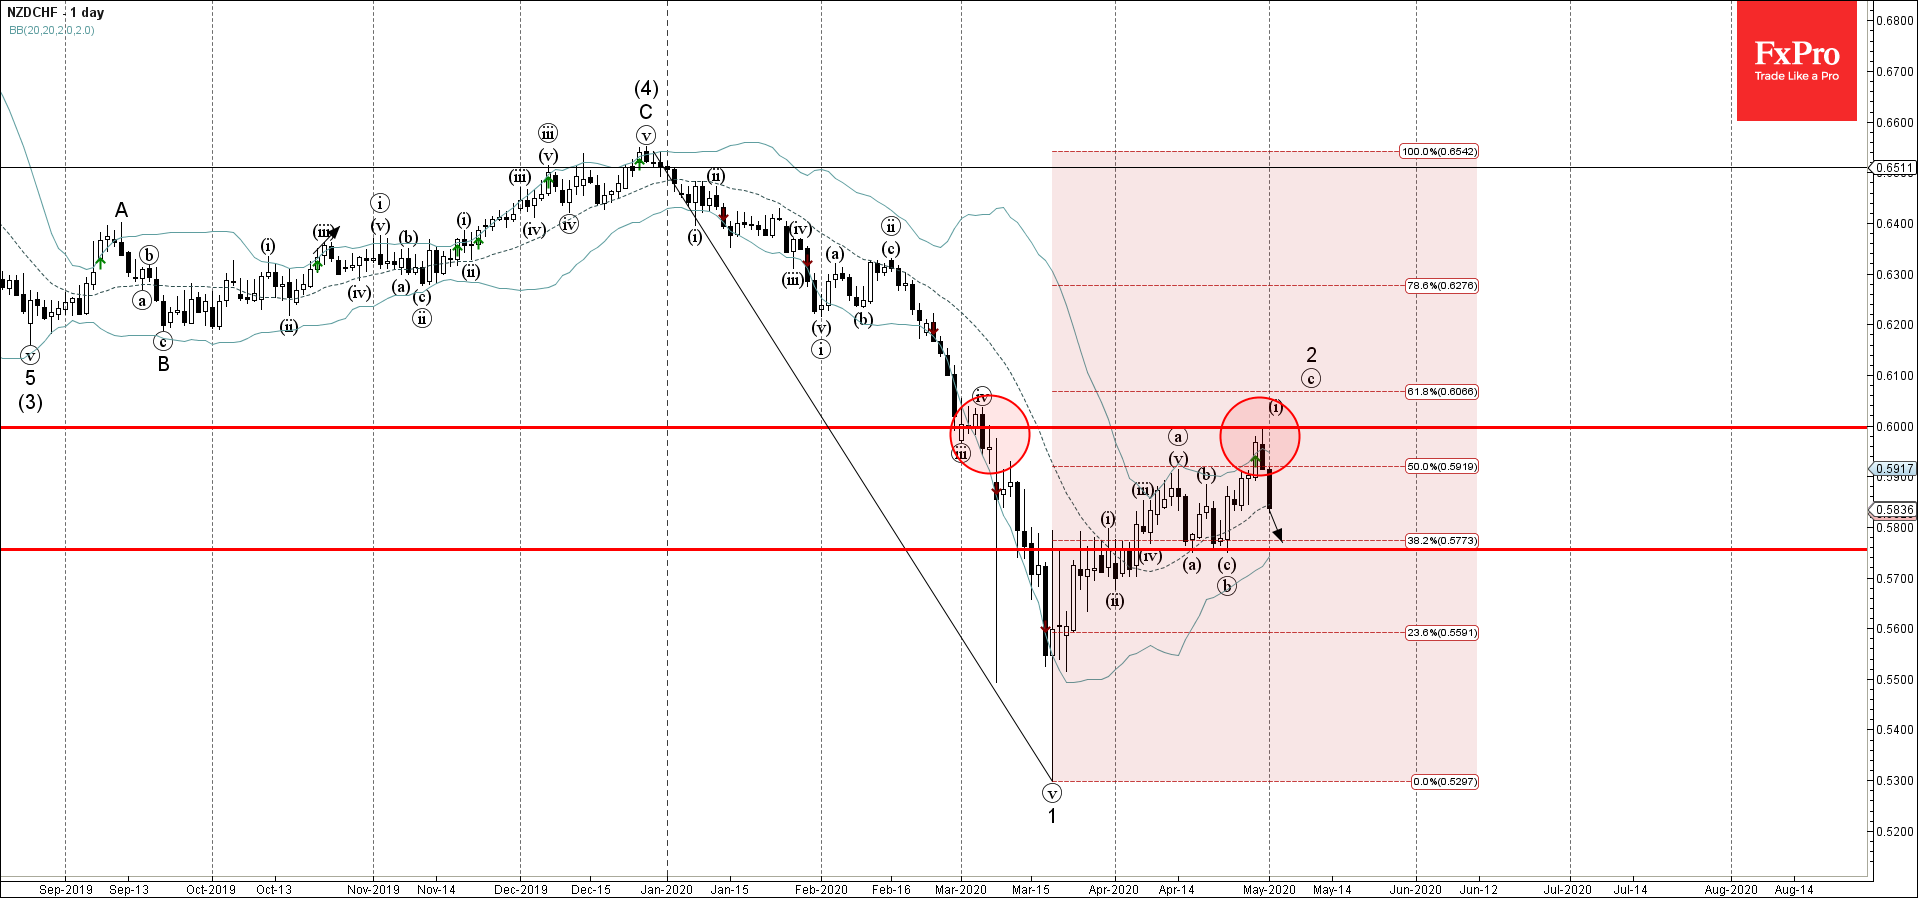
- NZDCHF reversed from resistance area
- Likely to fall to 0.5990
NZDCHF recently reversed down from the resistance area lying between the round resistance level 0,600 (which stopped the price in March), upper daily Bollinger Band and the 61.8% Fibonacci retracement of the previous extended impulse wave 1 from December.
The downward reversal from this resistance area stopped the previous short-term impulse wave (c).
NZDCHF is expected to fall further toward the next support level 0.5990 (which stopped the previous minor waves (a) and (b)).