Categories: Technical analysis

NZDCAD Wave Analysis – 7 September, 2022

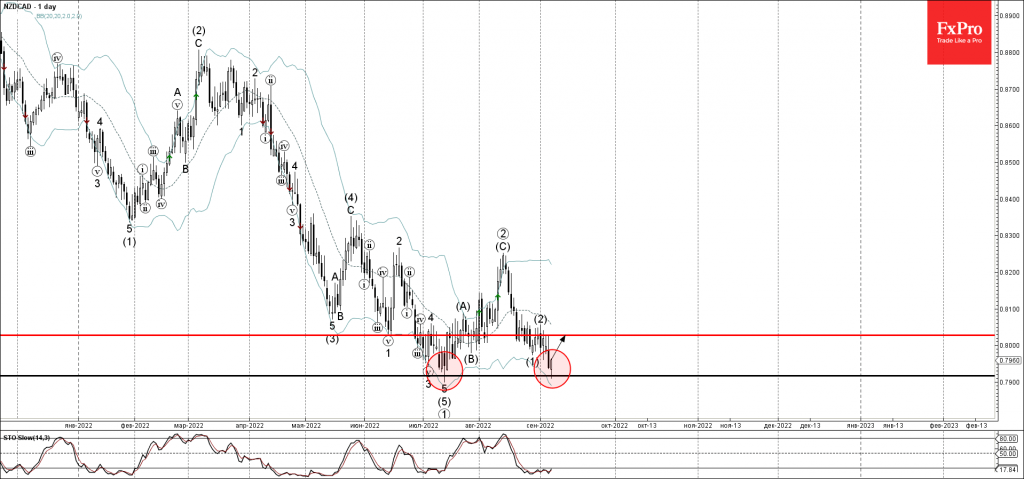
• NZDCAD reversed from strong support level 0.7920

• Likely to rise to resistance level 0.8030

NZDCAD currency pair recently reversed up from the strong support level 0.7920 (which stopped the earlier impulse waves 5 and (5) in July).

The upward reversal from the support level 0.7920 stopped the previous intermediate impulse wave (3).

Given the strength of the support level 0.7920 and the oversold daily Stochastic – NZDCAD can be expected to rise further toward the resistance level 0.8030 (which stopped the previous intermediate correction (2)).

The FxPro Tech Analysis Team

The FxPro technical experts prepare a daily analysis of the most active currency pairs (majors, crosses, exotics) and commodities. Selected instruments are reviewed on daily trends (D1, H4), using the active Elliott Wave setups, Japanese candlesticks, indicators, and support/resistance levels.

Share
Published by
The FxPro Tech Analysis Team
Tags: NZDCAD

Recent Posts

CHFJPY Wave Analysis – 9 January 2026

CHFJPY: ⬆️ Buy - CHFJPY reversed from support area - Likely to rise to resistance…

4 hours ago

Exxon Mobil Wave Analysis – 9 January 2026

Exxon Mobil: ⬆️ Buy - Exxon Mobil reversed from support area - Likely to rise…

4 hours ago

Pro News Weekly: Dollar Rebounds as Markets Test New Limits

Welcome to Pro News Weekly! Here’s what is shaping the markets: 💵 The U.S. dollar…

8 hours ago

Geopolitics will destroy the euro

•    EURUSD falls due to geopolitics and expectations of tariff removal •    Gold returns to…

16 hours ago

Platinum Wave Analysis – 8 January 2026

Platinum: ⬇️ Sell - Platinum reversed from pivotal resistance level 150.00 - Likely to fall to…

1 day ago

Baidu Wave Analysis – 8 January 2026

Baidu: ⬇️ Sell - Baidu reversed from resistance zone - Likely to fall to support level…

1 day ago

This website uses cookies