Categories: Technical analysis

NZDCAD Wave Analysis – 5 July 2023


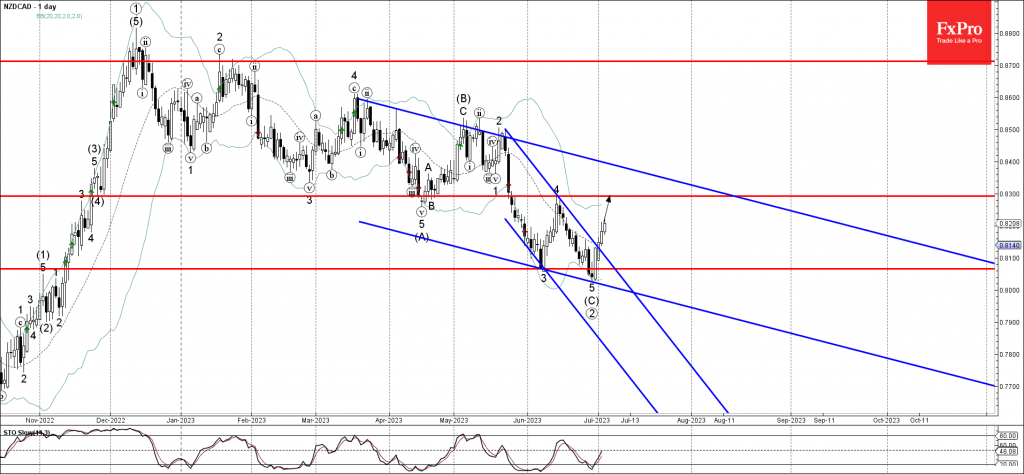
– NZDCAD broke accelerated down channel

– Likely to rise to resistance level 0.8300

NZDCAD currency pair continues to rise inside the minor impulse wave 1,which started earlier with the daily Morning Star from the key support level 0.8066.

The active impulse wave 1 belongs to the primary upward impulse sequence (3) from the end of June.

Having recently broken the accelerated down channel from May, NZDCAD currency pair can be expected to rise further toward the next resistance level 0.8300 (top of the earlier minor correction 4 from last month).

The FxPro Tech Analysis Team

The FxPro technical experts prepare a daily analysis of the most active currency pairs (majors, crosses, exotics) and commodities. Selected instruments are reviewed on daily trends (D1, H4), using the active Elliott Wave setups, Japanese candlesticks, indicators, and support/resistance levels.

Share
Published by
The FxPro Tech Analysis Team
Tags: NZDCAD

Recent Posts

Dow Jones Wave Analysis – 17 December 2025

Dow Jones: ⬇️ Sell - Dow Jones reversed from resistance level 49000.00 - Likely to fall…

3 hours ago

Comcast Wave Analysis – 17 December 2025

Comcast: ⬆️ Buy - Comcast broke resistance area - Likely to rise to resistance level 31.00…

3 hours ago

Platinum Wave Analysis – 17 December 2025

Platinum: ⬆️ Buy - Platinum broke resistance level 1800.00 - Likely to rise to resistance…

4 hours ago

Silver Wave Analysis – 17 December 2025

Silver: ⬆️ Buy - Silver broke resistance zone - Likely to rise to resistance level…

4 hours ago

The labour market did not scare the Fed

The Fed is in no hurry to cut rates, and Hassett is unlikely to accelerate…

8 hours ago

The crypto rebound fades with a 40% drop possible

Crypto market faces renewed downward pressure; Bitcoin may drop further, with diverging forecasts for 2026…

10 hours ago

This website uses cookies