Categories: Technical analysis

NZDCAD Wave Analysis – 4 May 2023


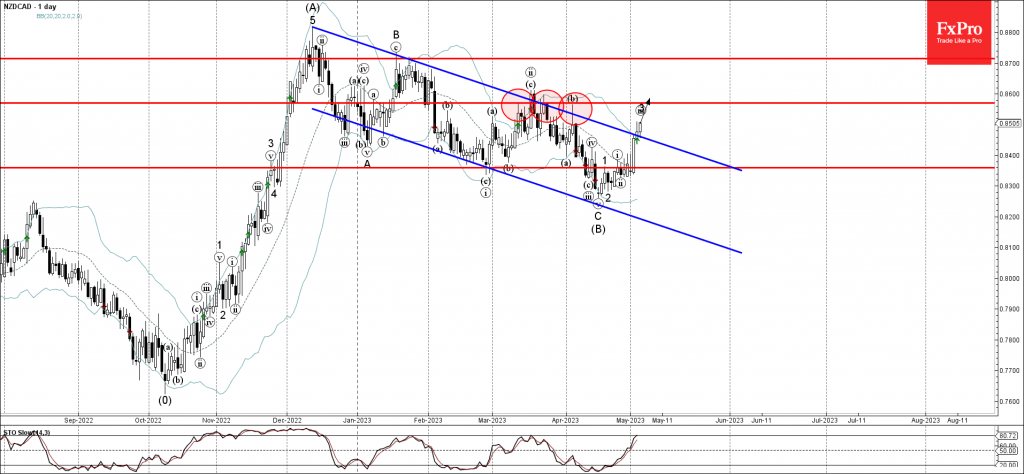
• NZDCAD broke daily down channel

• Likely to rise to resistance level 0.8570

NZDCAD currency pair recently broke the resistance trendline of the daily down channel from December (which encloses the previous intermediate ABC correction (B)).

The breakout of this down channel continues the minor impulse wave 3 of the intermediate impulse wave (B) from the middle of last month.

NZDCAD can be expected to rise further toward the next resistance level 0.8570 (which reversed the pair multiple times in March, target price for the completion of the active impulse wave 3).

The FxPro Tech Analysis Team

The FxPro technical experts prepare a daily analysis of the most active currency pairs (majors, crosses, exotics) and commodities. Selected instruments are reviewed on daily trends (D1, H4), using the active Elliott Wave setups, Japanese candlesticks, indicators, and support/resistance levels.

Share
Published by
The FxPro Tech Analysis Team
Tags: NZDCAD

Recent Posts

Amazon Wave Analysis 16 May 2024

- Amazon reversed from resistance level 190.00 - Likely to fall to support level 180.00…

8 hours ago

USDCHF Wave Analysis 16 May 2024

- USDCHF reversed from round support level 0.9000 - Likely to rise to resistance level…

8 hours ago

Crypto market shakes off consolidation

Market picture The release of US inflation data sparked a surge in risk asset purchases,…

19 hours ago

Gold Wave Analysis – 15 May, 2024

• Gold broke daily down channel • Likely to reach resistance level 2415.00 Gold recently…

1 day ago

AUDUSD Wave Analysis – 15 May, 2024

• AUDUSD broke key resistance level 0.6650 • Likely to reach resistance level 0.6760 AUDUSD…

1 day ago

EURUSD is trying to break the 5-month downtrend

The US dollar has been under relentless pressure since last Thursday, approaching more than one-month…

2 days ago

This website uses cookies