Categories: Technical analysis

NZDCAD Wave Analysis – 29 November, 2022

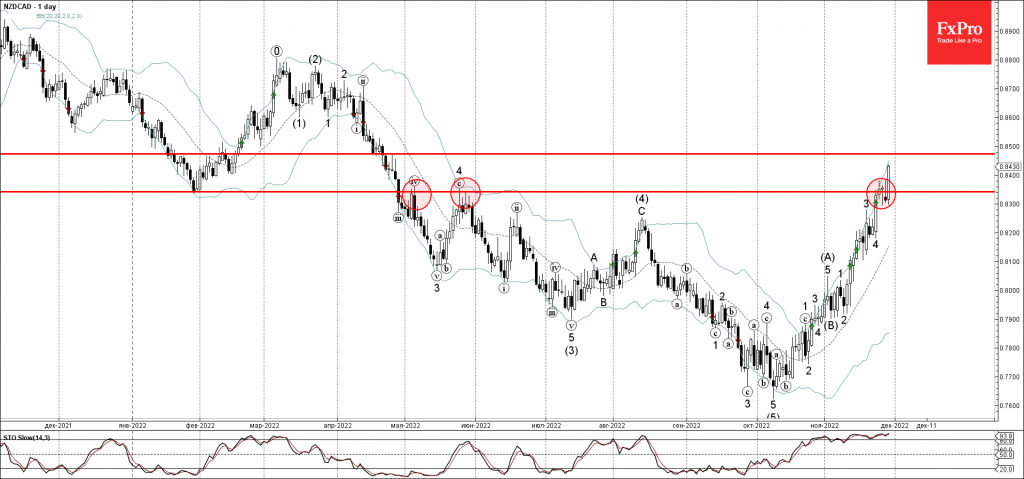
• NZDCAD broke key resistance level 0.8340

• Likely to rise to resistance level 0.8475

NZDCAD today broke up sharply above the key resistance level 0.8340 (which has been reversing the price from the start of May).

The breakout of the resistance level 0.8340 accelerated the short-term impulse wave 5 of the sharp intermediate impulse sequence (C) from the start of November.

Given the clear daily downtrend and strongly bearish CAD sentiment, NZDCAD can be expected to rise further toward the next resistance level 0.8475.

AddThis Website Tools
The FxPro Tech Analysis Team

The FxPro technical experts prepare a daily analysis of the most active currency pairs (majors, crosses, exotics) and commodities. Selected instruments are reviewed on daily trends (D1, H4), using the active Elliott Wave setups, Japanese candlesticks, indicators, and support/resistance levels.

Share
Published by
The FxPro Tech Analysis Team
Tags: NZDCAD

Recent Posts

Nikkei 225 Wave Analysis – 23 April 2025

Nikkei 225: ⬆️ Buy - Nikkei 225 broke the resistance area - Likely to rise…

5 hours ago

EURCHF Wave Analysis – 23 April 2025

EURCHF: ⬆️ Buy - EURCHF broke the resistance area - Likely to rise to resistance…

5 hours ago

CADJPY Wave Analysis – 23 April 2025

CADJPY: ⬆️ Buy - CADJPY reversed from strong support area - Likely to rise to…

7 hours ago

USDJPY Wave Analysis – 23 April 2025

USDJPY: ⬆️ Buy - USDJPY reversed from the support area - Likely to rise to…

7 hours ago

Europe’s Growth Stalls Again as the Euro Enters Correction Mode

Eurozone business activity slows as falling orders and declining confidence impact growth. Manufacturing PMI remains…

12 hours ago

The Rapid Assault on Crypto

The cryptocurrency market experienced a significant surge, with market capitalisation reaching $2.95 trillion. Bitcoin is…

16 hours ago