Categories: Technical analysis

NZDCAD Wave Analysis – 29 August, 2019

  • NZDCAD broke daily down channel
  • Further losses are likely

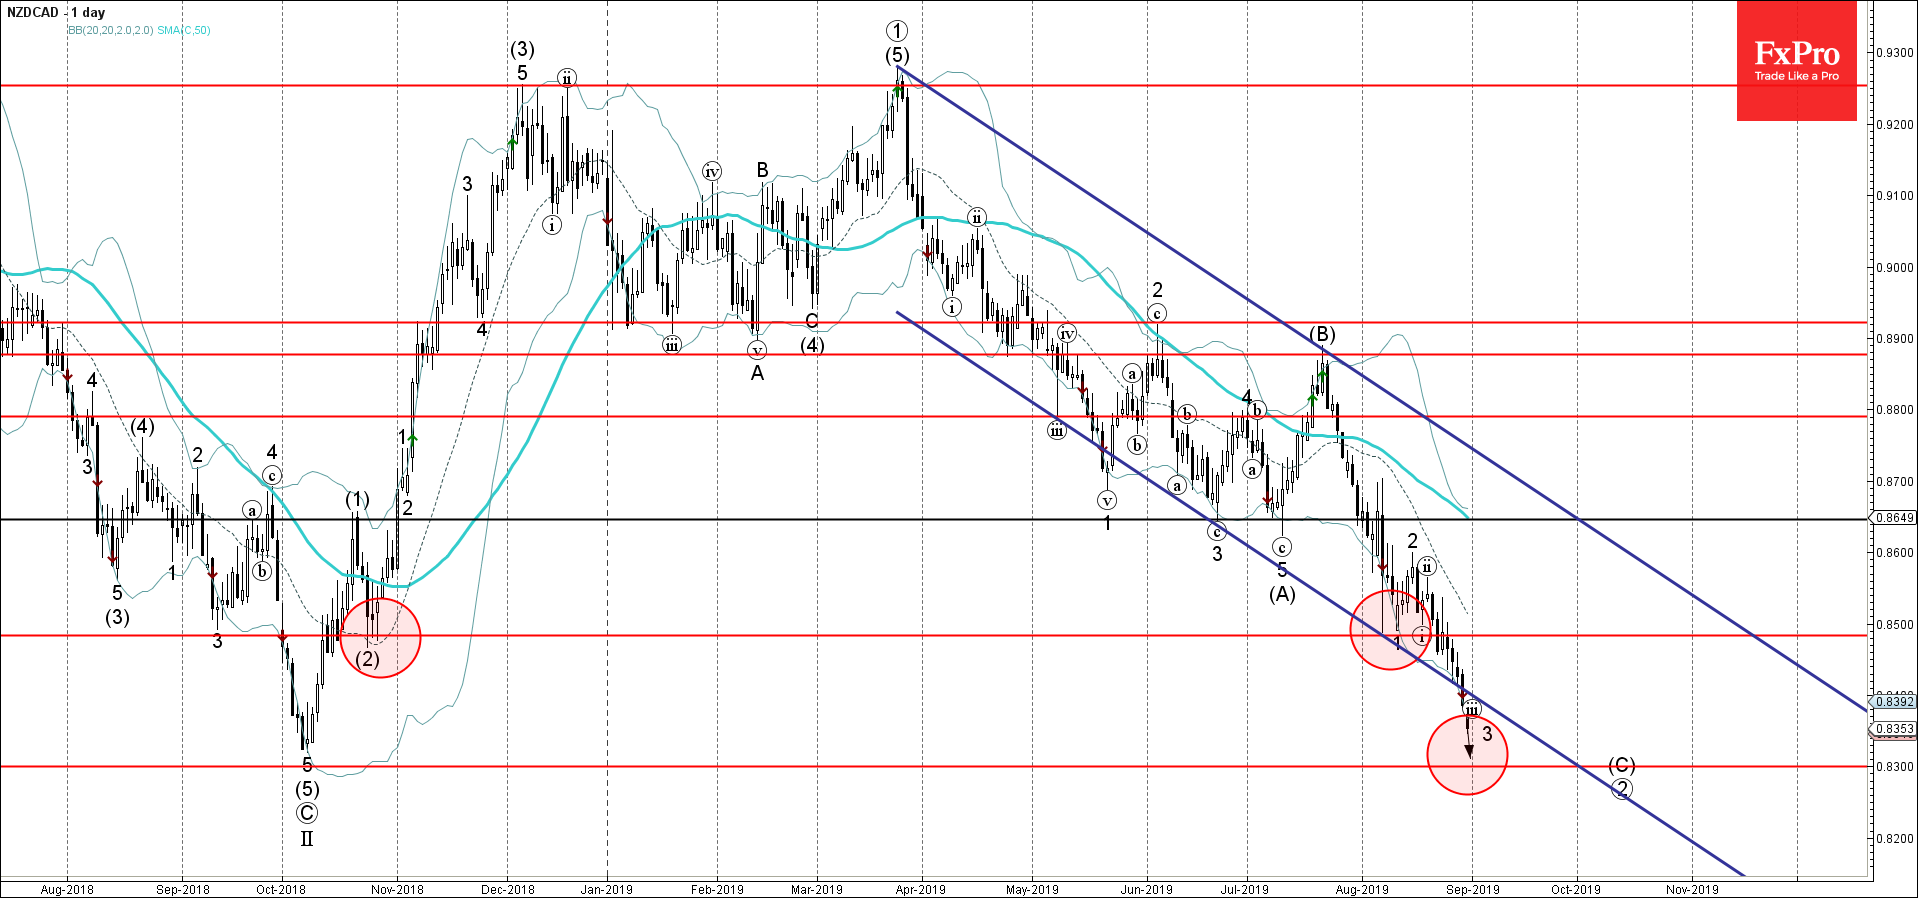
NZDCAD recently broke below the support trendline of the extended daily down channel from March – which encloses the active long-term ABC correction ②.

The breakout of this down channel follows the earlier breakout of the key support level 0.8500 – which stopped the previous impulse wave 1.

NZDCAD is expected to fall further and retest the next support level 0.8300 (target price for completion of active ABC correction ②).

The FxPro Tech Analysis Team

The FxPro technical experts prepare a daily analysis of the most active currency pairs (majors, crosses, exotics) and commodities. Selected instruments are reviewed on daily trends (D1, H4), using the active Elliott Wave setups, Japanese candlesticks, indicators, and support/resistance levels.

Share
Published by
The FxPro Tech Analysis Team
Tags: NZDCAD

Recent Posts

Solana Wave Analysis – 5 December 2025

Solana: ⬇️ Sell - Solana reversed from resistance zone - Likely to fall to support…

1 hour ago

EURAUD Wave Analysis – 5 December 2025

EURAUD : ⬇️ Sell - EURAUD broke the support level 1.7600 - Likely to fall…

1 hour ago

Forex has set its priorities

In 2026, experts favour the yen, see modest euro growth, and expect pressure on the…

5 hours ago

Bear market rebound in crypto is likely to continue

Crypto rebounds continue; Bitcoin faces resistance, with a mixed market outlook ahead, as regulatory changes…

6 hours ago

Coca-Cola Wave Analysis – 4 December 2025

Coca-Cola: ⬇️ Sell - Coca-Cola reversed from long-term resistance level 73.25 - Likely to fall to…

20 hours ago

DraftKings Wave Analysis – 4 December 2025

DraftKings: ⬆️ Buy - DraftKings reversed from support zone - Likely to rise to resistance level…

20 hours ago

This website uses cookies