Categories: Technical analysis

NZDCAD Wave Analysis – 27 December, 2021

• NZDCAD reversed from resistance level 0.8750

• Likely to fall to support level 0.6850

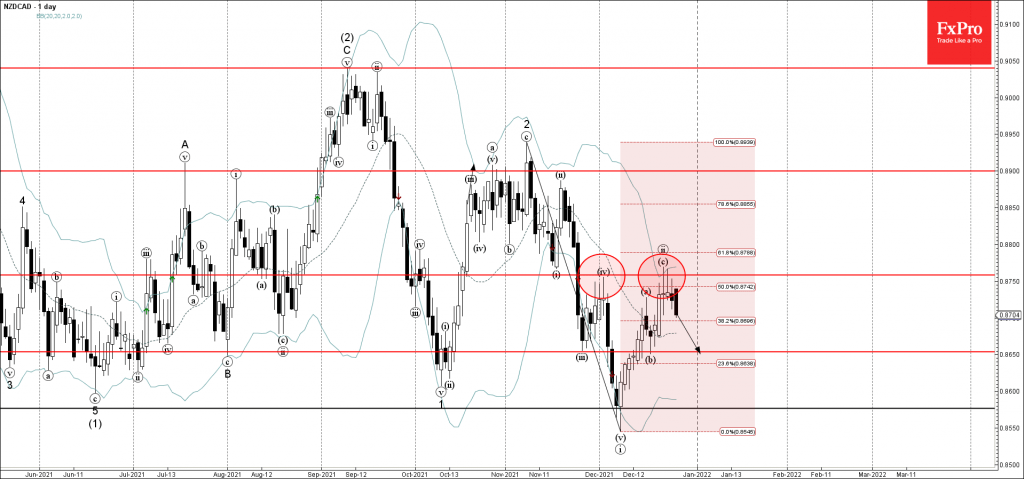
NZDCAD currency pair recently reversed down with the daily Shooting Star from the resistance level 0.8750 (which has been reversing the price form the start of December, as can be seen below).

The resistance zone near the resistance level 0.8750 was strengthened by the upper daily Bollinger Band and by the 50% Fibonacci correction of the downward impulse (i) from the start of November.

NZDCAD can be expected to fall further toward the next support level 0.6850 (low of the previous minor correction (b)).

The FxPro Tech Analysis Team

The FxPro technical experts prepare a daily analysis of the most active currency pairs (majors, crosses, exotics) and commodities. Selected instruments are reviewed on daily trends (D1, H4), using the active Elliott Wave setups, Japanese candlesticks, indicators, and support/resistance levels.

Share
Published by
The FxPro Tech Analysis Team
Tags: NZDCAD

Recent Posts

The crypto market is ready to grow further

Market picture The crypto market cooled off on Thursday afternoon, but on Friday morning, buyers…

32 mins ago

Amazon Wave Analysis 16 May 2024

- Amazon reversed from resistance level 190.00 - Likely to fall to support level 180.00…

13 hours ago

USDCHF Wave Analysis 16 May 2024

- USDCHF reversed from round support level 0.9000 - Likely to rise to resistance level…

13 hours ago

Crypto market shakes off consolidation

Market picture The release of US inflation data sparked a surge in risk asset purchases,…

24 hours ago

Gold Wave Analysis – 15 May, 2024

• Gold broke daily down channel • Likely to reach resistance level 2415.00 Gold recently…

2 days ago

AUDUSD Wave Analysis – 15 May, 2024

• AUDUSD broke key resistance level 0.6650 • Likely to reach resistance level 0.6760 AUDUSD…

2 days ago

This website uses cookies