Categories: Technical analysis

NZDCAD Wave Analysis – 22 July, 2019

  • NZDCAD broke resistance area
  • Further gains are likely

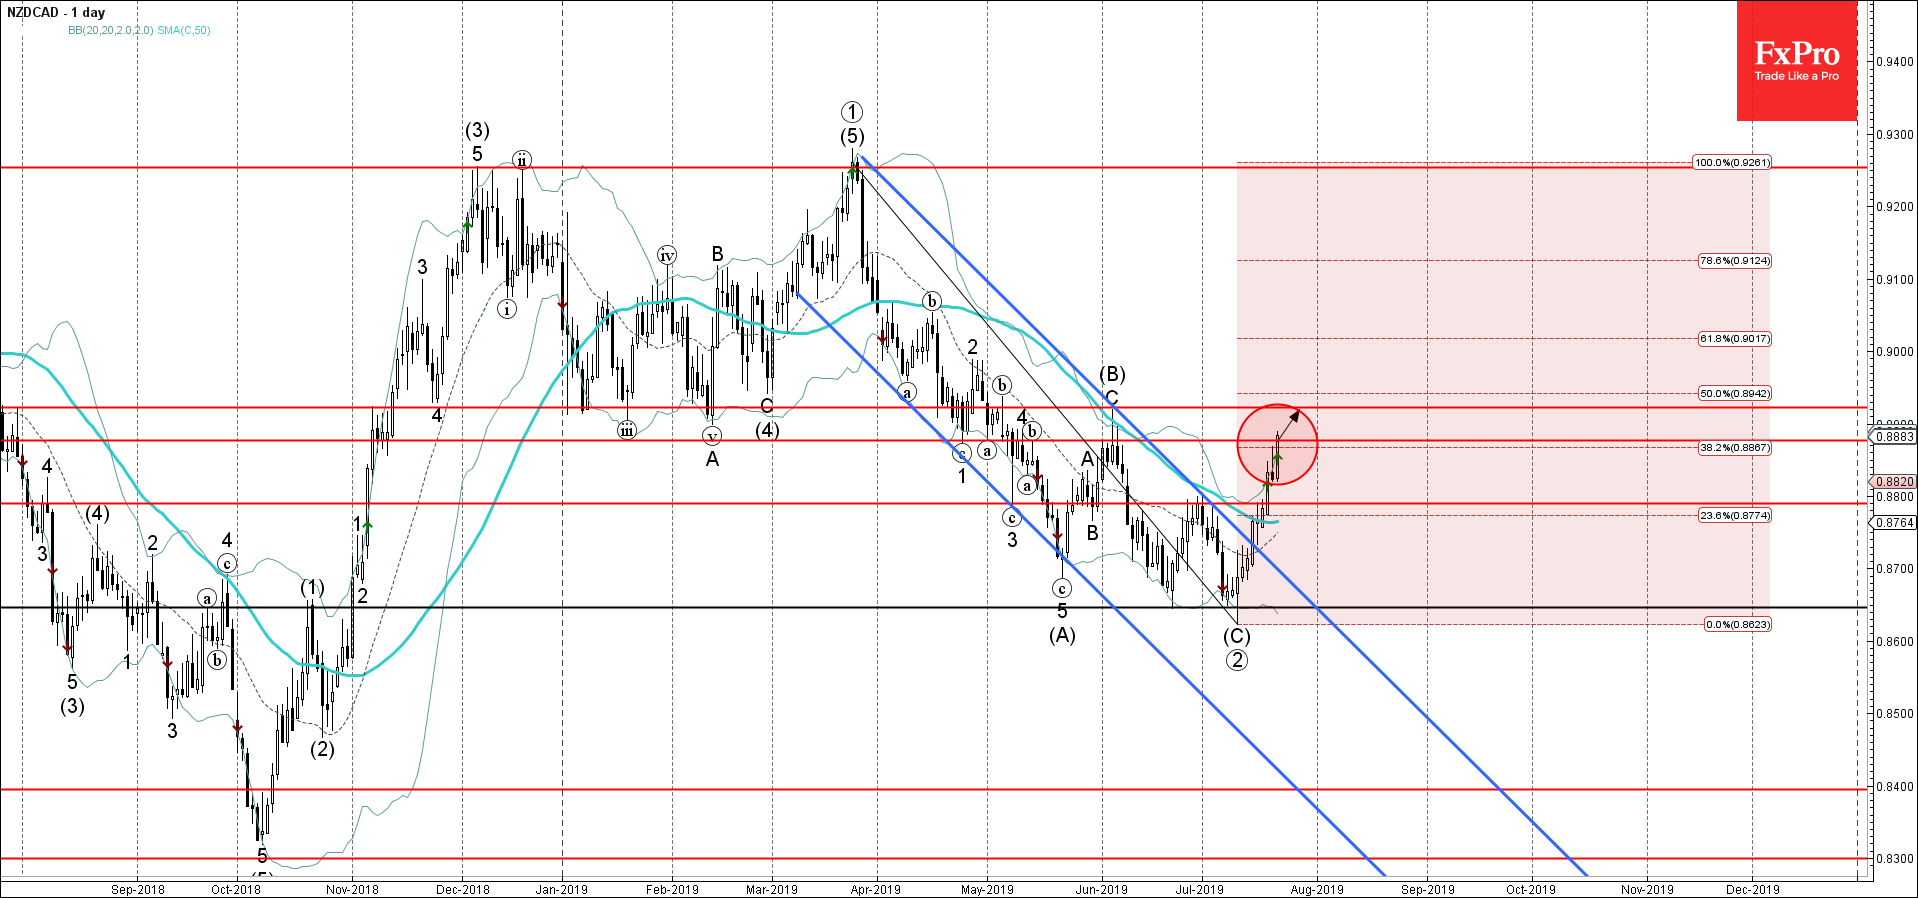
NZDCAD today broke the resistance area lying between the resistance level 0.8875 and the 38.2% Fibonacci correction of the previous long-term ABC correction form March.

The breakout of this resistance area should strengthen the bullish pressure on this currency pair.

NZDCAD is expected to rise further and retest the next resistance level 0.8920 (top of the previous medium-term (B)-wave from June).

AddThis Website Tools
The FxPro Tech Analysis Team

The FxPro technical experts prepare a daily analysis of the most active currency pairs (majors, crosses, exotics) and commodities. Selected instruments are reviewed on daily trends (D1, H4), using the active Elliott Wave setups, Japanese candlesticks, indicators, and support/resistance levels.

Share
Published by
The FxPro Tech Analysis Team
Tags: NZDCAD

Recent Posts

NZDUSD Wave Analysis – 19 March 2025

NZDUSD: ⬇️ Sell - NZDUSD reversed from the resistance level 0.5820 - Likely to fall…

7 hours ago

EURUSD Wave Analysis – 19 March 2025

EURUSD: ⬇️ Sell - EURUSD reversed from resistance level 1.0930 - Likely to fall to…

7 hours ago

Ethereum gives way

The crypto market remains in a downtrend, with Ethereum losing market share while Bitcoin's share…

12 hours ago

GBPUSD Wave Analysis – 18 March 2025

GBPUSD: ⬆️ Buy - GBPUSD reversed from support zone - Likely to rise to resistance…

1 day ago

GBPAUD Wave Analysis – 18 March 2025

GBPAUD: ⬆️ Buy - GBPAUD reversed from the support zone - Likely to rise to…

1 day ago

Solana Wave Analysis – 18 March 2025

Solana: ⬇️ Sell - Solana reversed from the resistance zone - Likely to fall to…

1 day ago