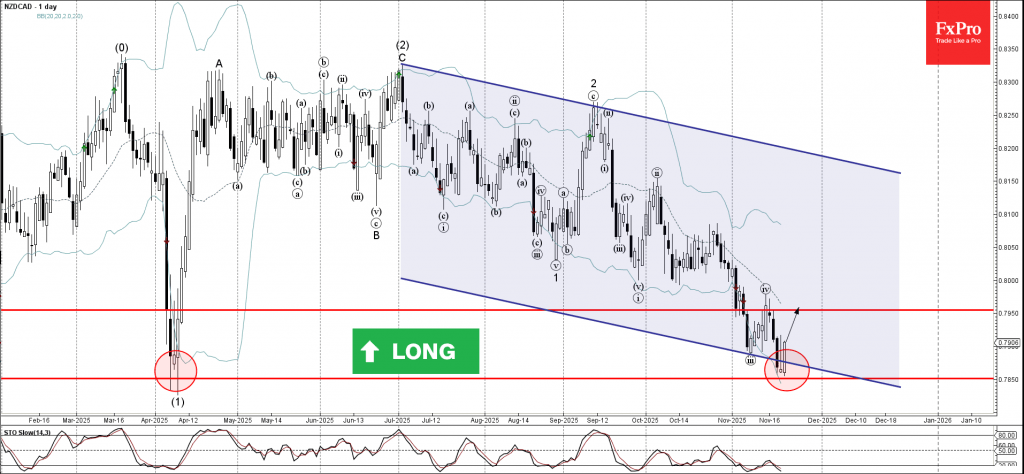
Categories: Technical analysis

NZDCAD Wave Analysis – 21 November 2025

NZDCAD: ⬆️ Buy

– NZDCAD reversed from support area

– Likely to rise to resistance level 0.7950

NZDCAD currency pair recently reversed from support area between the powerful long-term support level 0.7850 (which reversed the price sharply in April), lower daily Bollinger Band and the support trendline of the daily down channel from July.

The upward reversal from this support area is currently forming the daily Japanese candlesticks reversal pattern Morning Star – strong buy signal form this currency pair.

Given the oversold daily Stochastic, NZDCAD currency pair can be expected to rise to the next resistance level 0.7950.

The FxPro Tech Analysis Team

The FxPro technical experts prepare a daily analysis of the most active currency pairs (majors, crosses, exotics) and commodities. Selected instruments are reviewed on daily trends (D1, H4), using the active Elliott Wave setups, Japanese candlesticks, indicators, and support/resistance levels.

Share
Published by
The FxPro Tech Analysis Team
Tags: NZDCAD

Recent Posts

EURAUD Wave Analysis – 6 January 2026 Wave Analysis – 6 January 2026

EURAUD: ⬇️ Sell - EURAUD broke strong support level 1.7465 - Likely to fall to…

8 hours ago

IBM Wave Analysis – 6 January 2026

IBM: ⬆️ Buy - IBM reversed from support zone - Likely to rise to resistance…

8 hours ago

Palladium Wave Analysis – 6 January 2026

Palladium: ⬆️ Buy - Palladium reversed from round support level 1600.00 - Likely to rise…

8 hours ago

Amazon Wave Analysis – 6 January 2026

Amazon: ⬆️ Buy - Amazon broke resistance zone - Likely to rise to resistance level…

8 hours ago

Pro News Flash: Gold Bulls Take Control

🥇 Gold is regaining momentum as investors lean into geopolitics, a softer US dollar and…

14 hours ago

The dollar is forced to retreat

• The reduction in geopolitical risks in Venezuela has weakened the greenback. •  Precious metal investors…

18 hours ago

This website uses cookies