- NZDCAD reversed from resistance area
- Likely to fall to 0.8370
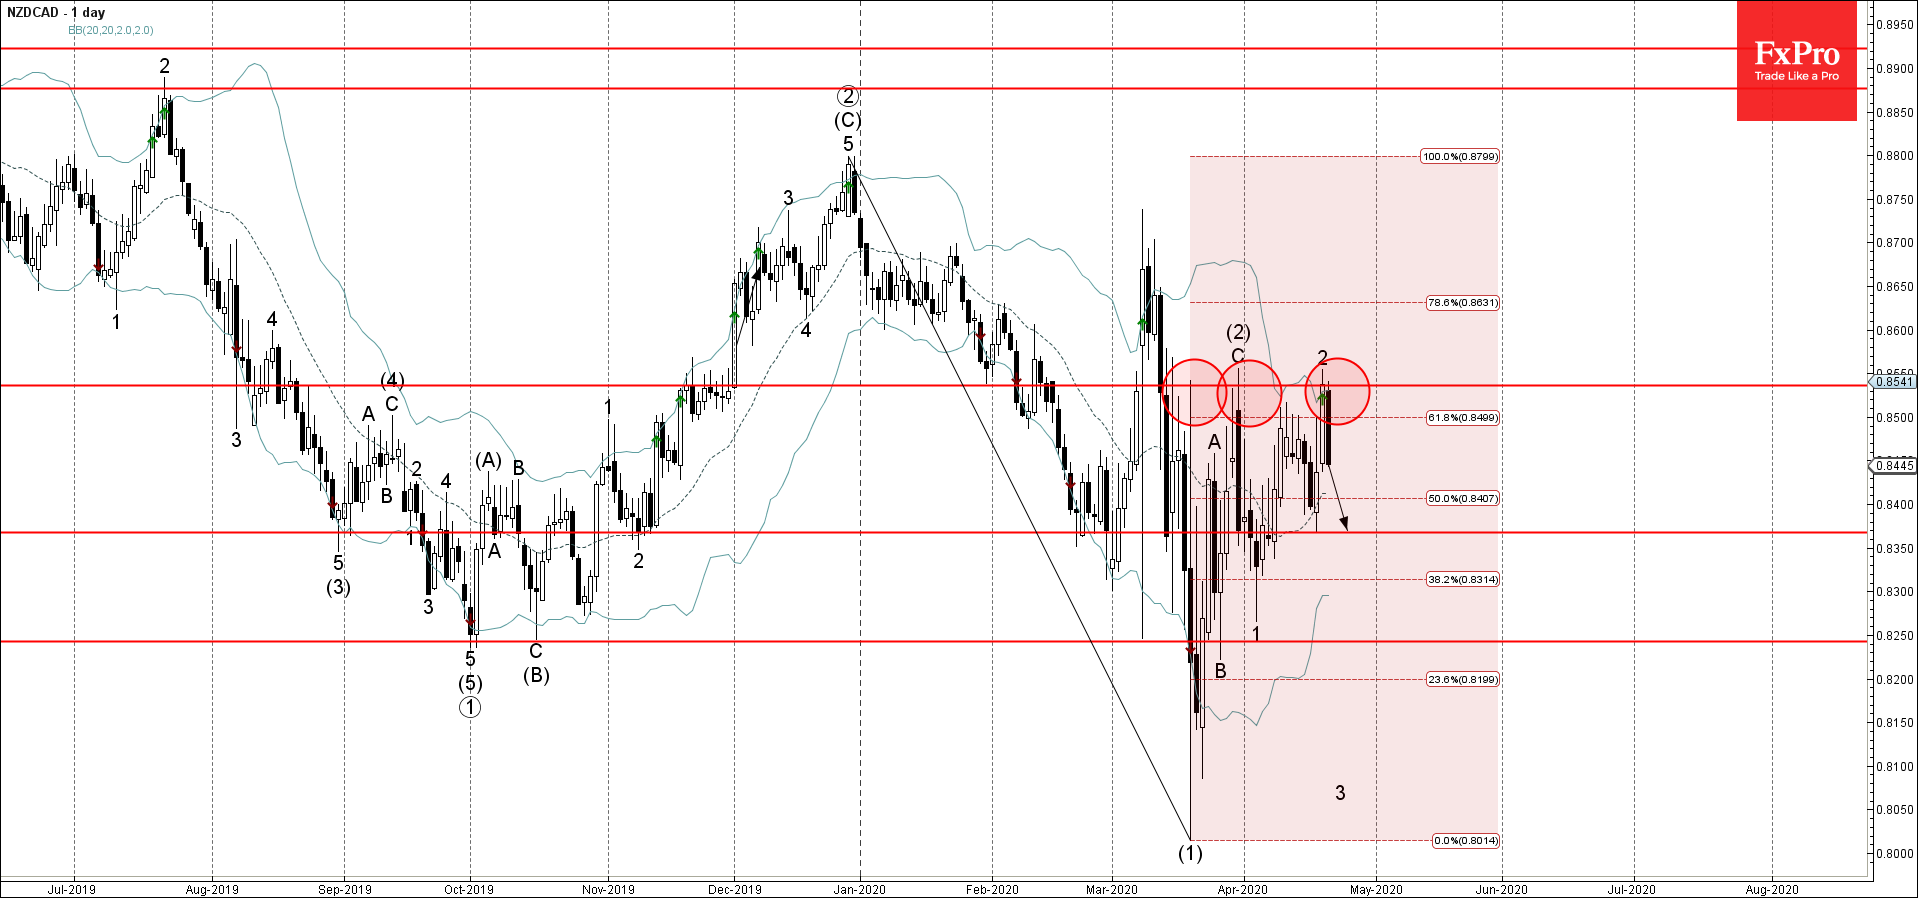
NZDCAD recently reversed down from the resistance area lying between the key resistance level 0.8535, upper daily Bollinger Band and the 61.8% Fibonacci correction of the previous downward impulse (1) from December.
The downward reversal from this resistance area started the active short-term impulse wave 3.
NZDCAD is expected to fall further toward the next support level 0.8370 (low of the earlier reversal pattern Bullish Engulfing).