Categories: Technical analysis

NZDCAD Wave Analysis – 19 November 2025

NZDCAD: ⬇️ Sell

– NZDCAD reversed from resistance zone

– Likely to fall to support level 0.7850

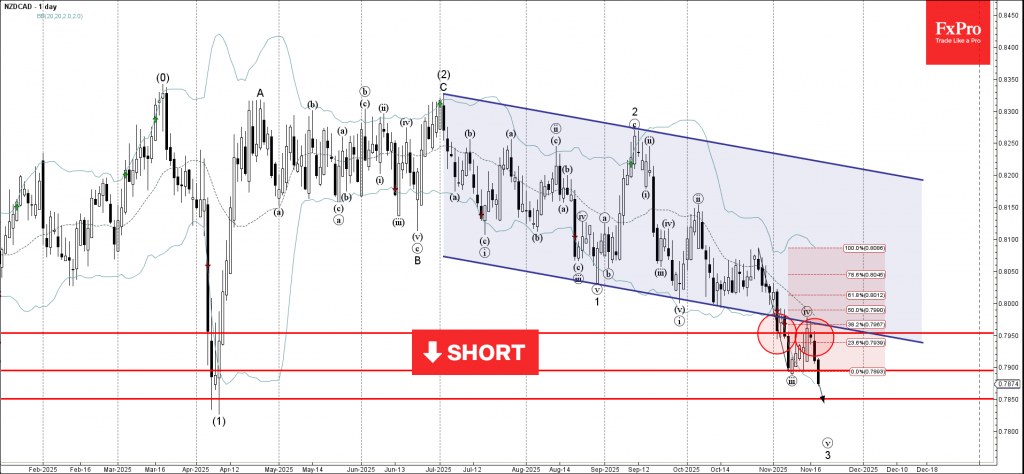
NZDCAD currency pair recently reversed down from the resistance zone between the resistance level 0.7950, 20-day moving average and the lower trendline of the recently broken down channel from July.

The downward reversal from this resistance zone accelerated the active impulse wave iii – which belongs to the impulse waves 3 and (3).

Given the clear daily downtrend, NZDCAD currency pair can be expected to fall further to the next support level 0.7850, which reversed the rice sharply in April.

The FxPro Tech Analysis Team

The FxPro technical experts prepare a daily analysis of the most active currency pairs (majors, crosses, exotics) and commodities. Selected instruments are reviewed on daily trends (D1, H4), using the active Elliott Wave setups, Japanese candlesticks, indicators, and support/resistance levels.

Share
Published by
The FxPro Tech Analysis Team
Tags: NZDCAD

Recent Posts

Platinum Wave Analysis – 8 January 2026

Platinum: ⬇️ Sell - Platinum reversed from pivotal resistance level 150.00 - Likely to fall to…

6 hours ago

Baidu Wave Analysis – 8 January 2026

Baidu: ⬇️ Sell - Baidu reversed from resistance zone - Likely to fall to support level…

6 hours ago

EURUSD Wave Analysis – 8 January 2026

EURUSD: ⬇️ Sell - EURUSD broke daily up channel - Likely to fall to support…

8 hours ago

WTI crude oil Wave Analysis – 8 January 2026

WTI crude oil: ⬆️ Buy - WTI crude oil reversed from support zone - Likely…

8 hours ago

Do not underestimate dollar

Positive macro statistics for the US are helping the greenback. Gold could rise to $4,610…

15 hours ago

Crypto fails to find support for a breakout

Crypto markets fell amid caution; Bitcoin and Ethereum face technical and investor shifts, with privacy…

15 hours ago

This website uses cookies