Categories: Technical analysis

NZDCAD Wave Analysis – 19 March, 2020

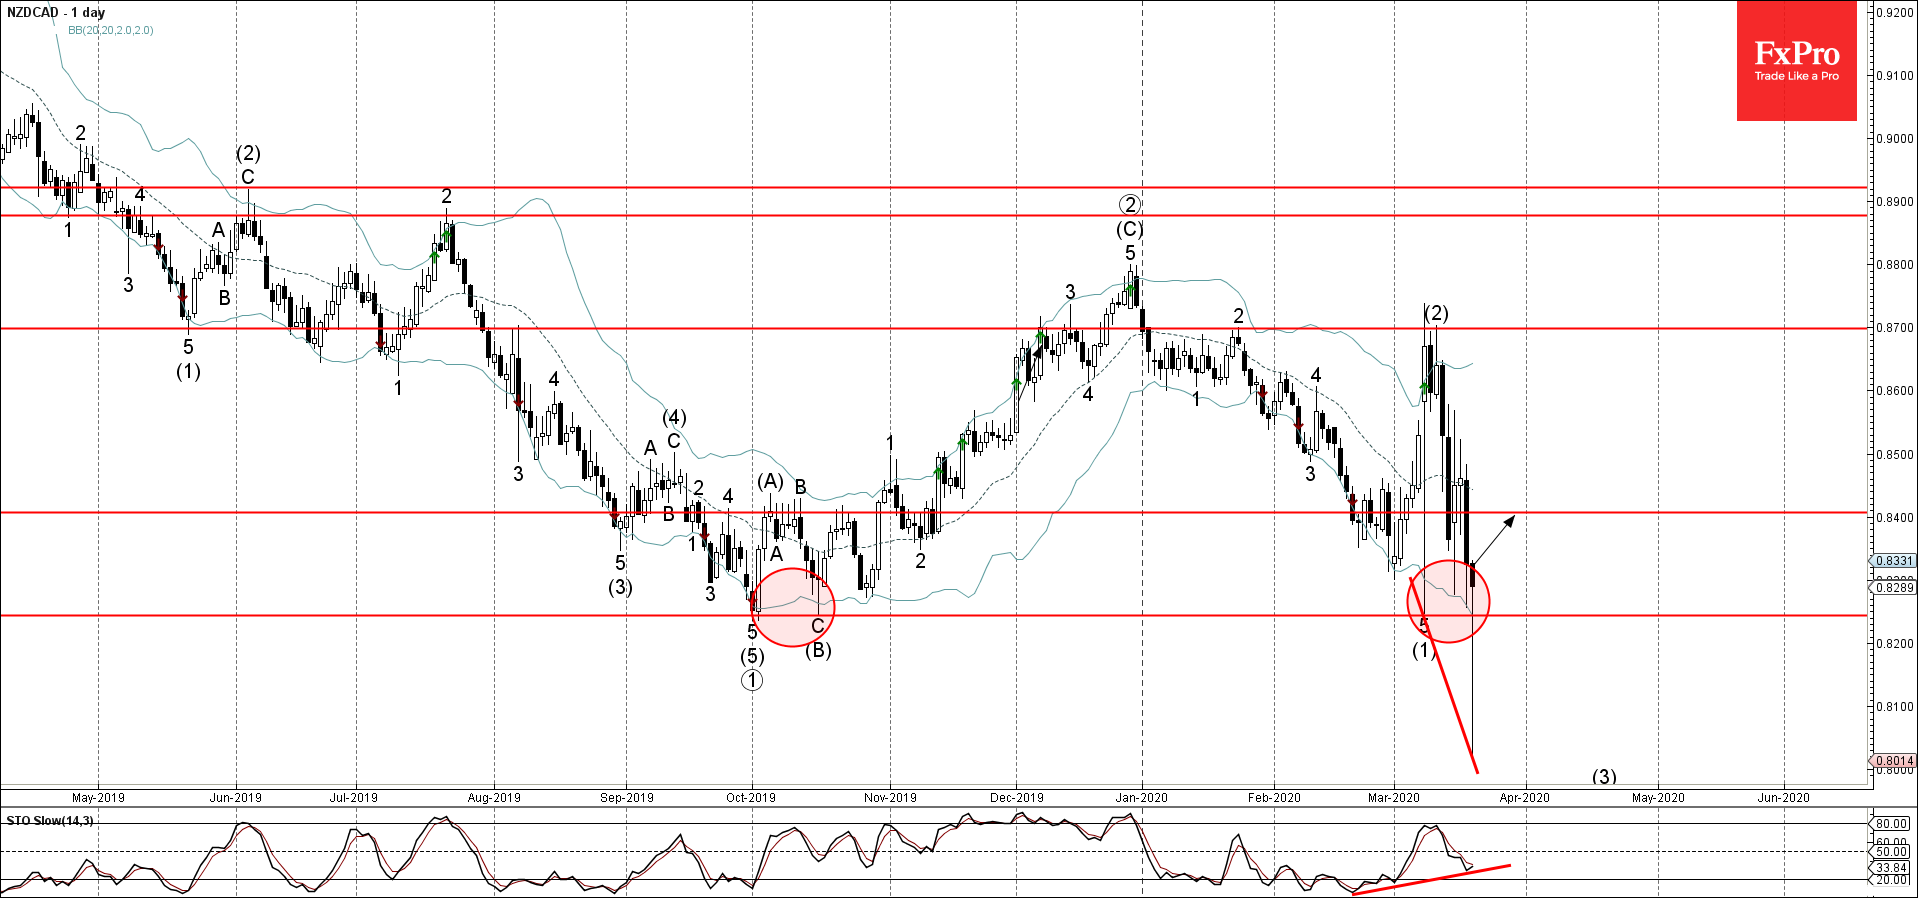
  • NZDCAD reversed from pivotal support level 0.8240
  • Likely to rise to 0.8400

NZDCAD recently reversed up from the pivotal support level 0.8240 (which has been reversing the price from last October) – strengthened by the lower daily Bollinger Band.

The upward reversal from the support level 0.8240 stopped the earlier impulse wave (3) – which started earlier from the key resistance level 0.8700.

With the clear bullish divergence on the daily Stochastic indicator – NZDCAD is likely to rise further toward the next resistance level 0.8400.

The FxPro Tech Analysis Team

The FxPro technical experts prepare a daily analysis of the most active currency pairs (majors, crosses, exotics) and commodities. Selected instruments are reviewed on daily trends (D1, H4), using the active Elliott Wave setups, Japanese candlesticks, indicators, and support/resistance levels.

Share
Published by
The FxPro Tech Analysis Team
Tags: NZDCAD

Recent Posts

EURJPY Wave Analysis 2 May 2024

- EURJPY under strong bearish pressure - Likely to fall to support level 163.10 EURJPY…

10 mins ago

WTI crude oil Wave Analysis 2 May 2024

- WTI broke round support level 80.00 - Likely to fall to support level 76.00…

11 mins ago

ADP hints at another strong NFP on Friday

The monthly ADP labour market report showed that America created 192K new jobs in April, above…

1 day ago

Fed’s hawkish tone risks sinking S&P500 to 4700

Bears showed strength ahead of the FOMC decision.  U.S. indices sagged on Tuesday as investors…

1 day ago

A new stage of Bitcoin’s decline

Market Picture  Bitcoin's closing price on Tuesday became the lowest since late February, confirming the…

1 day ago

Ebay Wave Analysis 30 April 2024

- Ebay under the bearish pressure - Likely to fall to support level 51.00 Ebay…

2 days ago

This website uses cookies