Categories: Technical analysis

NZDCAD Wave Analysis – 19 August, 2022

• NZDCAD broke daily up channel

• Likely to fall to support level 0.8000

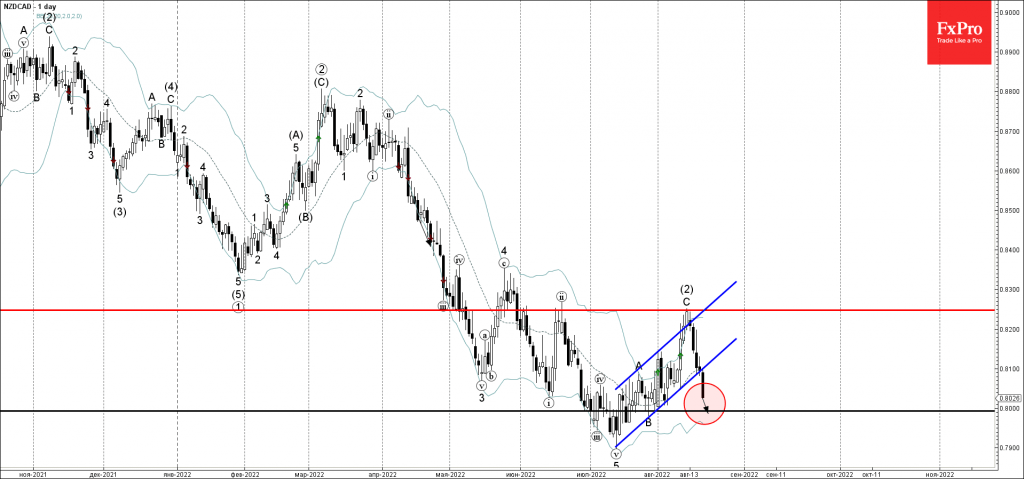
NZDCAD recently broke the support trendline of the daily up channel from the middle of July (which encloses the previous intermediate ABC correction (2)).

The breakout of this up channel from should accelerate the active medium-term downward impulse wave (3).

Given clear multi-month downtrend – NZDCAD can be expected to fall further toward the next round support level 0.8000 (low of the earlier wave B from last month).

The FxPro Tech Analysis Team

The FxPro technical experts prepare a daily analysis of the most active currency pairs (majors, crosses, exotics) and commodities. Selected instruments are reviewed on daily trends (D1, H4), using the active Elliott Wave setups, Japanese candlesticks, indicators, and support/resistance levels.

Share
Published by
The FxPro Tech Analysis Team
Tags: NZDCAD

Recent Posts

Do not underestimate dollar

Positive macro statistics for the US are helping the greenback. Gold could rise to $4,610…

1 hour ago

Crypto fails to find support for a breakout

Crypto markets fell amid caution; Bitcoin and Ethereum face technical and investor shifts, with privacy…

2 hours ago

SP500. Current situation #sp500 #tradelikeapro #trading #trandingshorts #tradingstrategy #fxpro

Today is Thursday, January 8th, and we continue talking about the markets. Today, we will…

3 hours ago

NZDCAD Wave Analysis – 7 January 2026

NZDCAD: ⬆️ Buy - NZDCAD reversed from support zone - Likely to rise to resistance…

16 hours ago

Bitcoin Wave Analysis – 7 January 2026

Bitcoin: ⬇️ Sell - Bitcoin reversed from resistance zone - Likely to fall to support…

16 hours ago

EURGBP Wave Analysis – 7 January 2026

EURGBP: ⬆️ Buy - EURGBP reversed from support zone - Likely to rise to resistance…

16 hours ago

This website uses cookies