Categories: Technical analysis

NZDCAD Wave Analysis – 18 July, 2019

  • NZDCAD rising inside impulse wave (1)
  • Further gains are likely

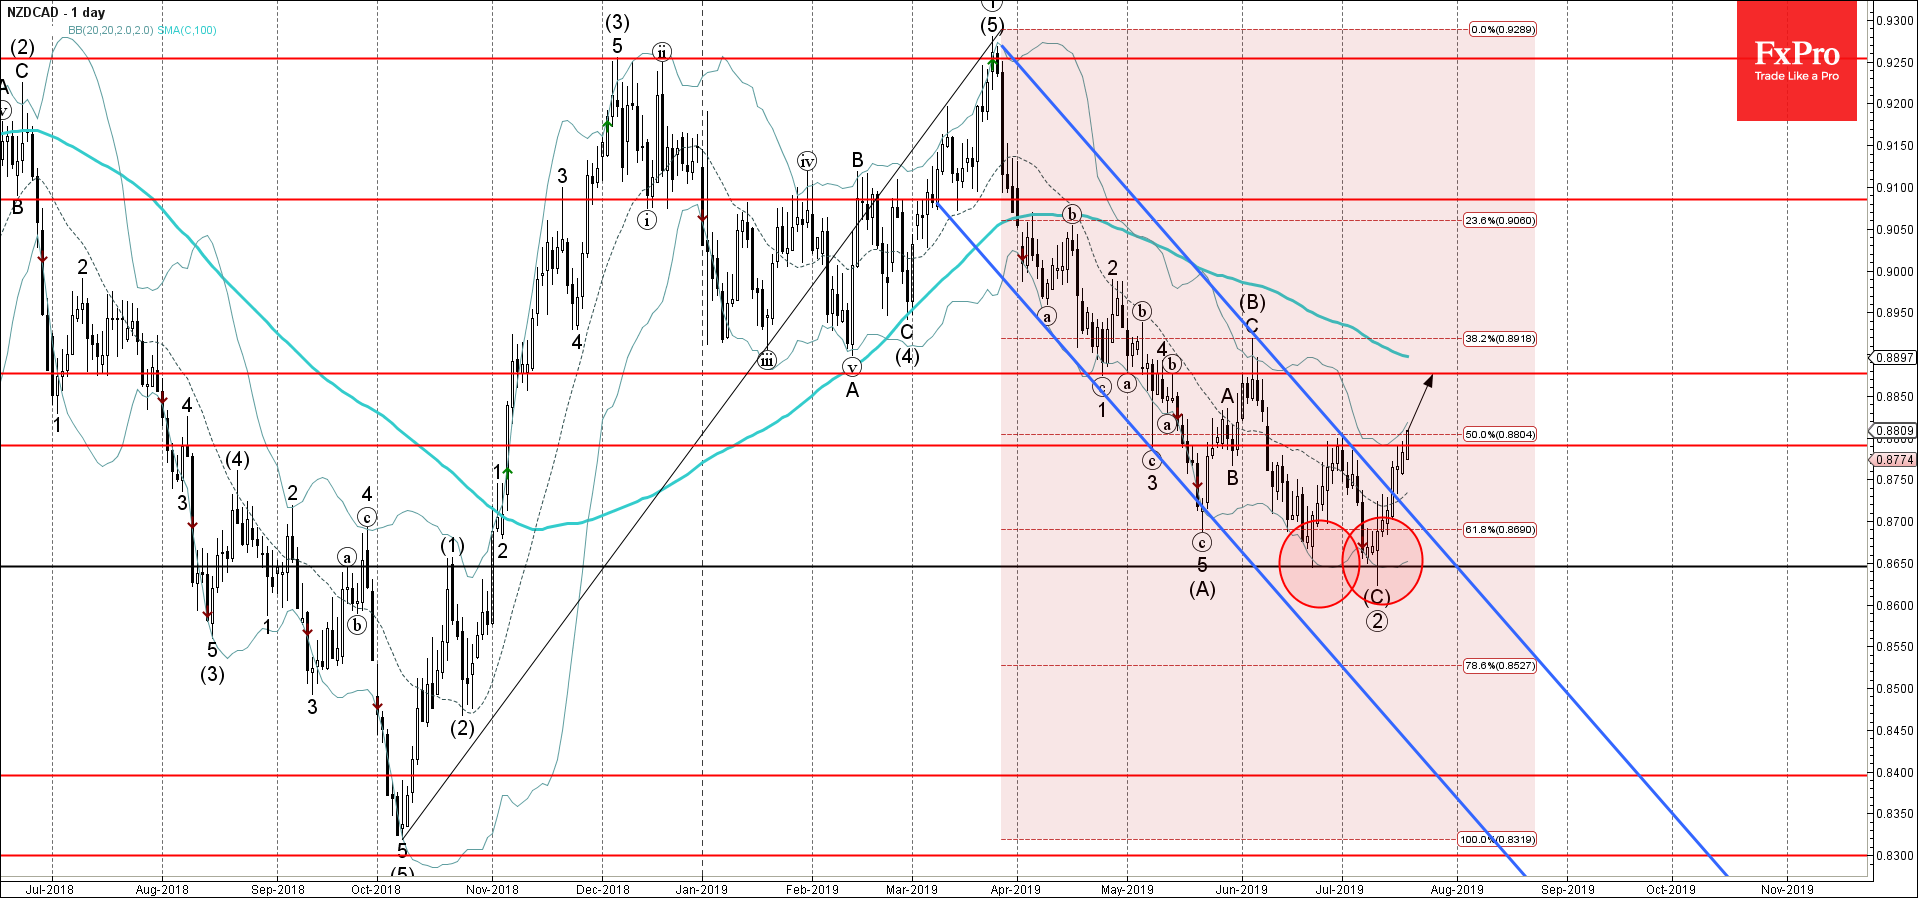
NZDCAD continues to rise sharply inside the short-term impulse wave (1), which previously recently broke the pivotal resistance level 0.8790 (which also reversed the price at the end of June).

The breakout of this resistance level was preceded by the breakout of the daily down channel from the end of March – which strengthened the bullish pressure on this currency pair.

NZDCAD is expected to rise further and retest the next resistance level 0.8880 (target for the completion of the active impulse wave (iii)).

AddThis Website Tools
The FxPro Tech Analysis Team

The FxPro technical experts prepare a daily analysis of the most active currency pairs (majors, crosses, exotics) and commodities. Selected instruments are reviewed on daily trends (D1, H4), using the active Elliott Wave setups, Japanese candlesticks, indicators, and support/resistance levels.

Share
Published by
The FxPro Tech Analysis Team
Tags: NZDCAD

Recent Posts

Pfizer Wave Analysis – 27 March 2025

Pfizer: ⬇️ Sell - Pfizer broke support level 25.20 - Likely to fall to support level…

31 minutes ago

Silver Wave Analysis – 27 March 2025

Silver: ⬆️ Buy - Silver broke resistance area - Likely to rise to resistance level…

32 minutes ago

EURGBP Wave Analysis – 27 March 2025

EURGBP: ⬇️ Sell - EURGBP broke support area - Likely to fall to support level…

5 hours ago

3M Wave Analysis – 27 March 2025

3M: ⬇️ Sell - 3M reversed from resistance area - Likely to fall to support…

5 hours ago

Smashed Hopes for US Stocks Recovery

The US stock market faced resistance from new auto tariffs and concerns about global response,…

7 hours ago

Gold and Silver about to break the ceiling

Gold has experienced growth, reaching historical highs due to new tariff wars. Silver has also…

9 hours ago