Categories: Technical analysis

NZDCAD Wave Analysis – 18 April, 2022

• NZDCAD under bearish pressure
• Likely to fall to support level 0.8400

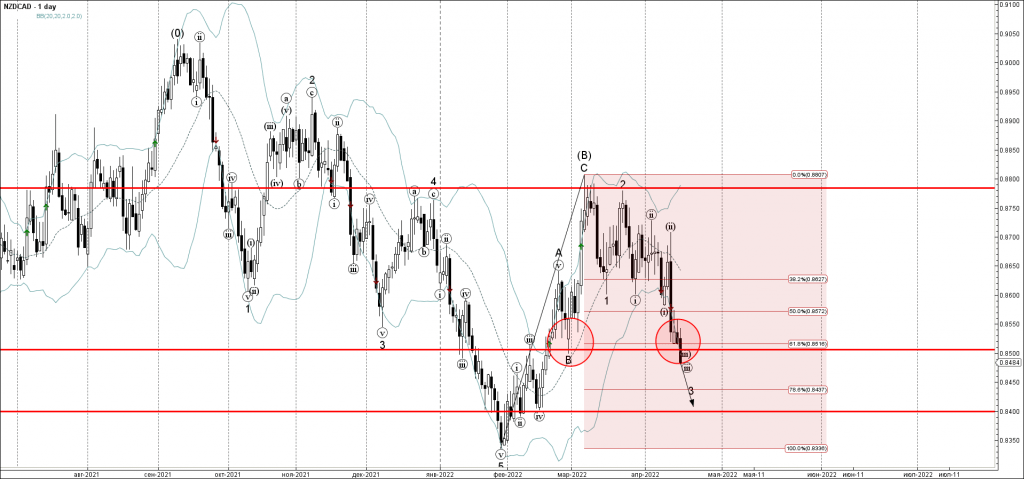
NZDCAD is under the bearish pressure after the price broke the support zone located between the support level 0.8500 (low of wave B from February) and the 61.8% Fibonacci correction of the upward wave from February.

The breakout of this support zone should accelerate the active impulse waves 3 and (C).

NZDCAD can be expected to fall further toward the next support level 0.8400 (low of wave (iv) from February and the forecast price for the completion of the active impulse wave 3).

The FxPro Tech Analysis Team

The FxPro technical experts prepare a daily analysis of the most active currency pairs (majors, crosses, exotics) and commodities. Selected instruments are reviewed on daily trends (D1, H4), using the active Elliott Wave setups, Japanese candlesticks, indicators, and support/resistance levels.

Share
Published by
The FxPro Tech Analysis Team
Tags: NZDCAD

Recent Posts

CHFJPY Wave Analysis – 9 January 2026

CHFJPY: ⬆️ Buy - CHFJPY reversed from support area - Likely to rise to resistance…

4 hours ago

Exxon Mobil Wave Analysis – 9 January 2026

Exxon Mobil: ⬆️ Buy - Exxon Mobil reversed from support area - Likely to rise…

4 hours ago

Pro News Weekly: Dollar Rebounds as Markets Test New Limits

Welcome to Pro News Weekly! Here’s what is shaping the markets: 💵 The U.S. dollar…

8 hours ago

Geopolitics will destroy the euro

•    EURUSD falls due to geopolitics and expectations of tariff removal •    Gold returns to…

16 hours ago

Platinum Wave Analysis – 8 January 2026

Platinum: ⬇️ Sell - Platinum reversed from pivotal resistance level 150.00 - Likely to fall to…

1 day ago

Baidu Wave Analysis – 8 January 2026

Baidu: ⬇️ Sell - Baidu reversed from resistance zone - Likely to fall to support level…

1 day ago

This website uses cookies