- NZDCAD reversed from support area
- Further gains are likely
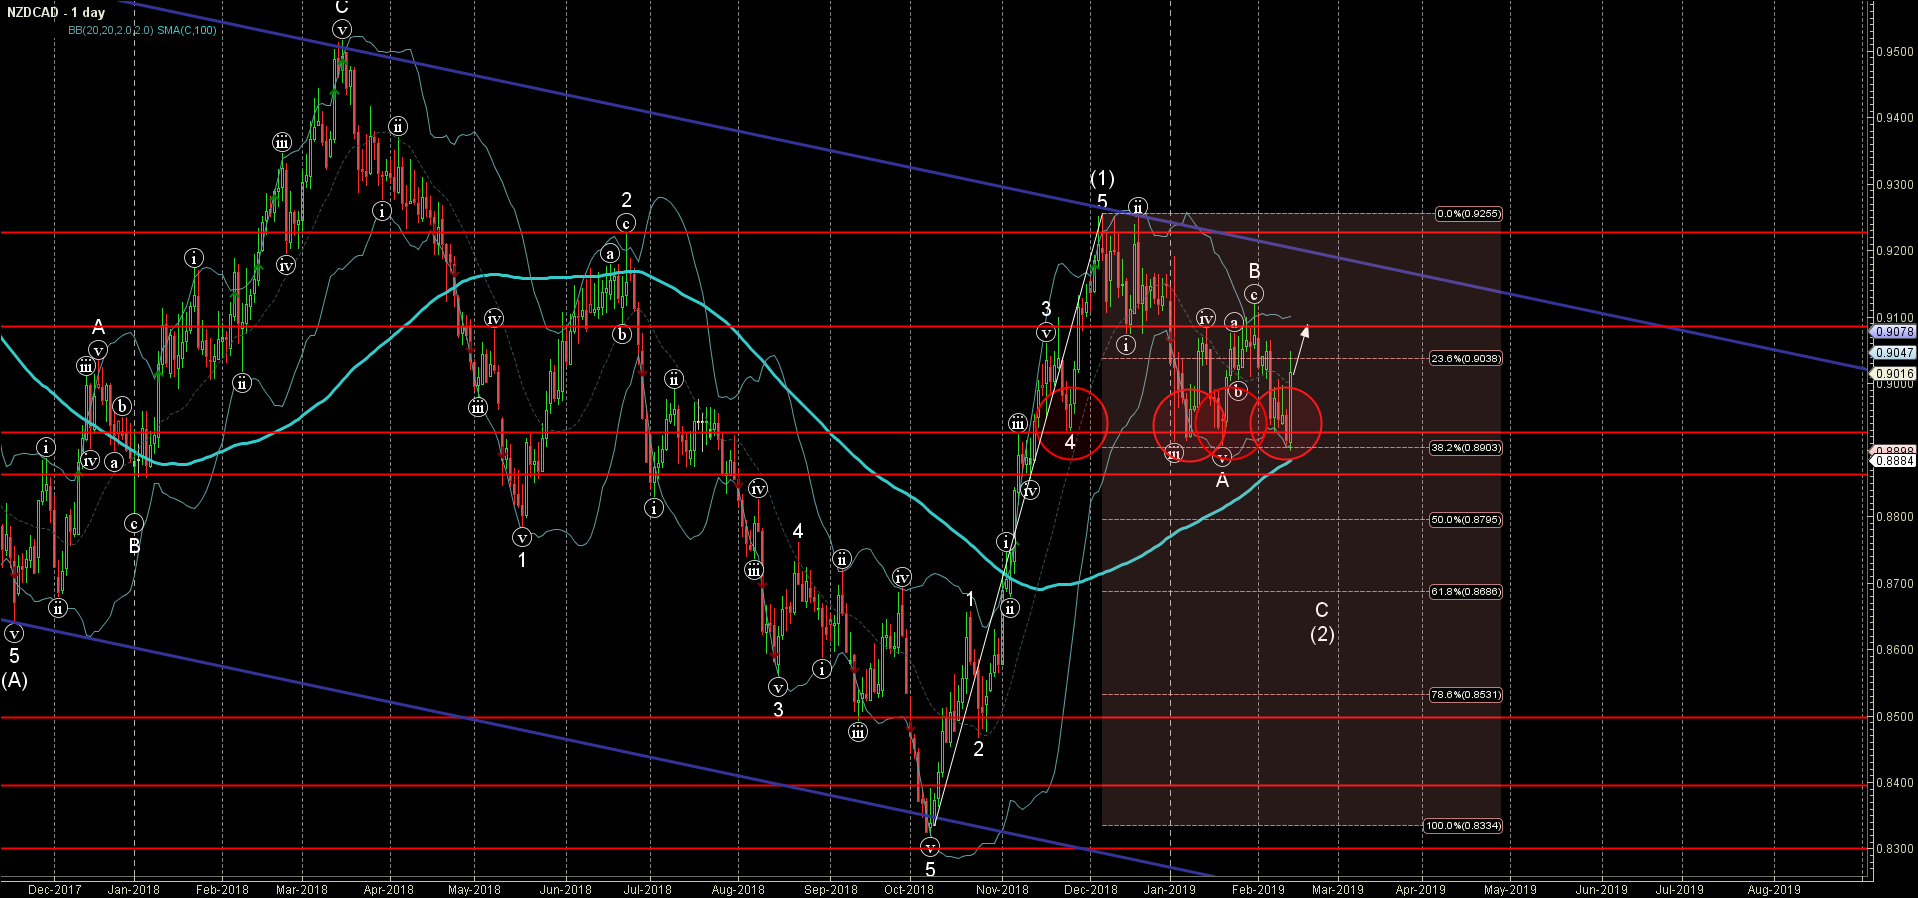
NZDCAD today reversed up from the support area lying between the pivotal support level 0.8920 (which has been reversing the price from the end of November), 100-day moving average, lower daily Bollinger Band and the 38.2% Fibonacci correction of the previous upward impulse (1) from October.
The upward reversal from this support area stopped the earlier impulse wave C of the active ABC correction (2) from December.
NZDCAD is expected to rise further and re-test the next resistance level 0.9100 (top of the previous waves (iv), (a) and B).