Categories: Technical analysis

Nvidia Wave Analysis – 20 February, 2020

  • Nvidia rising inside short-term impulse wave 3
  • Likely to rise to 330.00

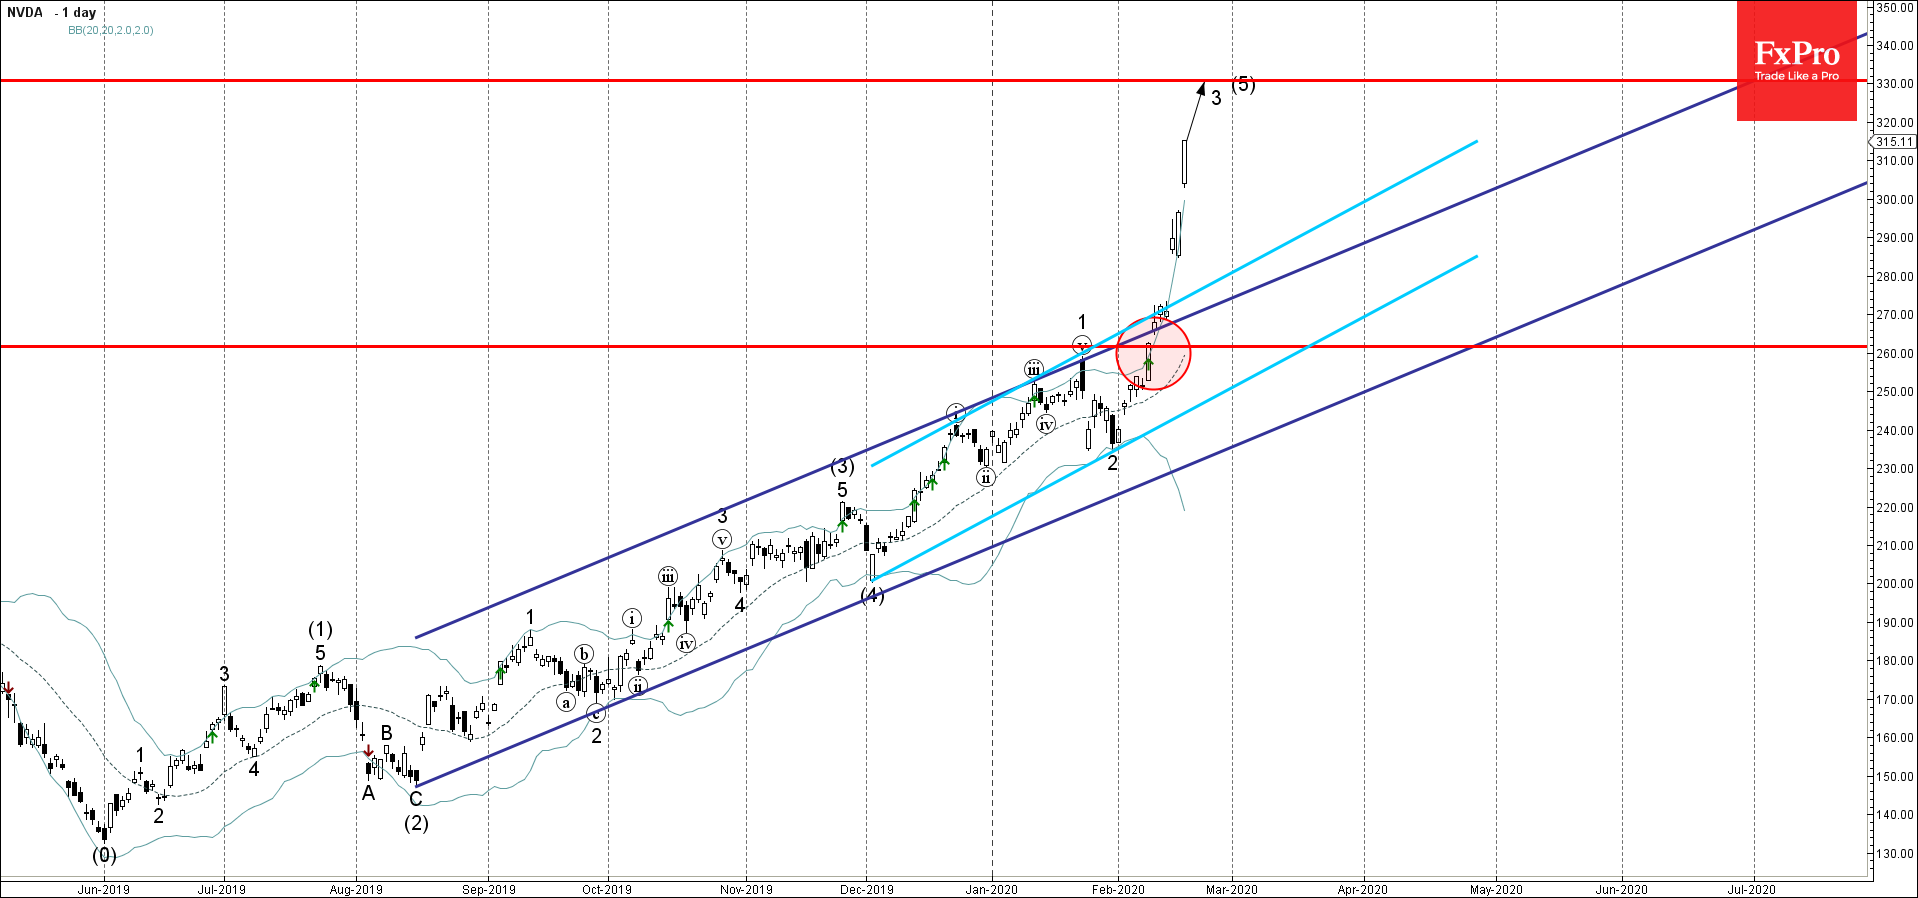
Nvidia has been rising sharply in the last few trading session inside the short-term impulse wave 3 – which belongs to the medium-term upward impulse sequence (5) from the start of December.

The price earlier broke through the resistance area lying between the resistance level 260.00 and the two resistance trendlines of two daily up channels from August and December.

Nvidia is likely to rise further toward the next resistance level 330.00 (target price for the completion of the active impulse wave (5)).

AddThis Website Tools
The FxPro Tech Analysis Team

The FxPro technical experts prepare a daily analysis of the most active currency pairs (majors, crosses, exotics) and commodities. Selected instruments are reviewed on daily trends (D1, H4), using the active Elliott Wave setups, Japanese candlesticks, indicators, and support/resistance levels.

Share
Published by
The FxPro Tech Analysis Team
Tags: NVDA

Recent Posts

Apple Wave Analysis – 16 April 2025

Apple: ⬇️ Sell - Apple reversed from resistance level 210.00 - Likely to fall to…

2 hours ago

AUDCAD Wave Analysis – 16 April 2025

AUDCAD: ⬇️ Sell - AUDCAD reversed from resistance zone - Likely to fall to support…

2 hours ago

US sales jump gives USD relief, but is driven by fears

US Total retail sales rose 1.4% in March, beating the expected 1.3% after rising 0.2%…

9 hours ago

Tariff news and resistance zone put pressure on crypto

The crypto market capitalisation decreased by 2.6% in 24 hours due to the announcement of…

12 hours ago

Gold Wave Analysis – 16 April 2025

Gold: ⬆️ Buy - Gold broke resistance zone - Likely to rise to the resistance…

16 hours ago

GBPUSD Wave Analysis – 16 April 2025

GBPUSD: ⬆️ Buy - GBPUSD broke key resistance level 1.3200 - Likely to rise to…

16 hours ago