Categories: Technical analysis

NVDA Wave Analysis – 29 October 2025

NVDA: ⬆️ Buy

– NVDA opened with the upward gap

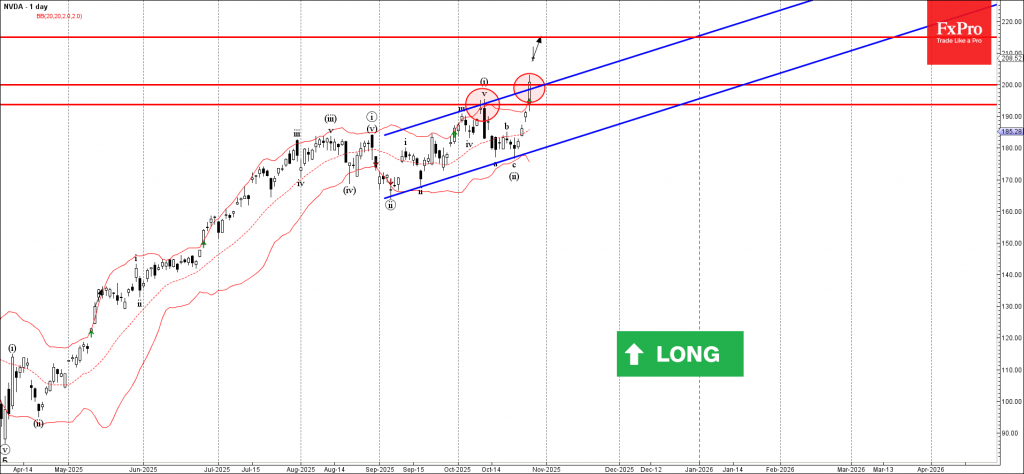
– Likely to rise to resistance level 215.00

NVDA stock opened today with the sharp upward gap, which follows the earlier breakout of the resistance zone between the resistance levels 193.75 and 200.00.

The breakout of the these resistance levels accelerated the active impulse wave iii of the extended intermediate impulse sequence 5 from April

Given the overriding daily uptrend, NVDA can be expected to rise to the next resistance level 215.00 (target price for the completion of the active impulse wave iii).

The FxPro Tech Analysis Team

The FxPro technical experts prepare a daily analysis of the most active currency pairs (majors, crosses, exotics) and commodities. Selected instruments are reviewed on daily trends (D1, H4), using the active Elliott Wave setups, Japanese candlesticks, indicators, and support/resistance levels.

Share
Published by
The FxPro Tech Analysis Team
Tags: NVDA

Recent Posts

EURJPY Wave Analysis – 31 December 2025

EURJPY: ⬆️ Buy - EURJPY reversed from support area - Likely to rise to resistance…

2 days ago

Binance Coin Wave Analysis – 31 December 2025

Binance Coin: ⬆️ Buy - Binance Coin broke Descending Triangle - Likely to rise to…

2 days ago

Uniswap Wave Analysis – 31 December 2025

Uniswap: ⬇️ Sell - Uniswap reversed from resistance area - Likely to fall to support…

2 days ago

S&P 500 Wave Analysis – 31 December 2025

S&P 500: ⬇️ Sell - S&P 500 reversed from strong resistance level 6935.00 - Likely…

2 days ago

The dollar may defy expectations

•  The return of American exceptionalism will help the greenback. •  The yen will start…

2 days ago

Stellar Wave Analysis – 30 December 2025

Stellar: ⬇️ Sell - Stellar reversed from resistance area - Likely to fall to support…

2 days ago

This website uses cookies