Categories: Technical analysis

NVDA Wave Analysis – 13 May 2025

Nvidia: ⬆️ Buy

– Nvidia broke resistance area

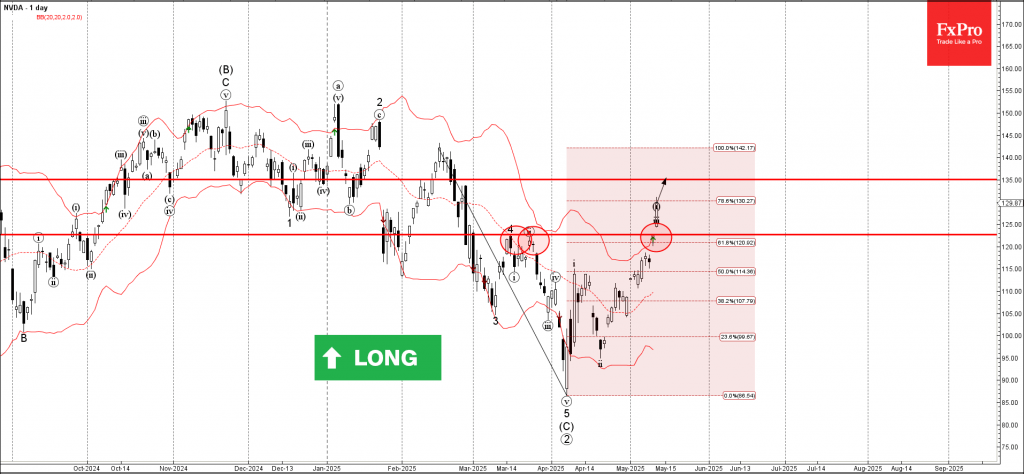
– Likely to rise to resistance level 135.00

Nvidia recently broke the resistance area between the resistance level 122.65 (which reversed waves 4 and ii in March) and the 61.8% Fibonacci correction of the downward impulse from February.

The breakout of this resistance area continues the active short-term impulse wave 1 of the intermediate impulse wave (1) from the start of April.

Nvidia can be expected to rise to the next resistance level 135.00, target price for the completion of the active impulse wave i.

The FxPro Tech Analysis Team

The FxPro technical experts prepare a daily analysis of the most active currency pairs (majors, crosses, exotics) and commodities. Selected instruments are reviewed on daily trends (D1, H4), using the active Elliott Wave setups, Japanese candlesticks, indicators, and support/resistance levels.

Share
Published by
The FxPro Tech Analysis Team
Tags: NVDA

Recent Posts

GBPUSD. Current situation #tradelikeapro #trading #tradingstrategy #tradingshorts #gbpusd #gbp

Today is Thursday, the 18th of December, and we'll be talking about the British pound…

3 hours ago

Bitcoin is holding, while Solana is on the edge

Bitcoin remains stable near $87K, outperforming altcoins, while Solana faces key support at $120. Institutional…

5 hours ago

The dollar’s wings have been clipped

Waller's dovish rhetoric halted the bears' attack on EURUSD. Slowing UK inflation caused the pound…

5 hours ago

Dow Jones Wave Analysis – 17 December 2025

Dow Jones: ⬇️ Sell - Dow Jones reversed from resistance level 49000.00 - Likely to fall…

21 hours ago

Comcast Wave Analysis – 17 December 2025

Comcast: ⬆️ Buy - Comcast broke resistance area - Likely to rise to resistance level 31.00…

21 hours ago

Platinum Wave Analysis – 17 December 2025

Platinum: ⬆️ Buy - Platinum broke resistance level 1800.00 - Likely to rise to resistance…

22 hours ago

This website uses cookies