Categories: Technical analysis

Novartis Wave Analysis – 10 December 2025

Novartis: ⬇️ Sell

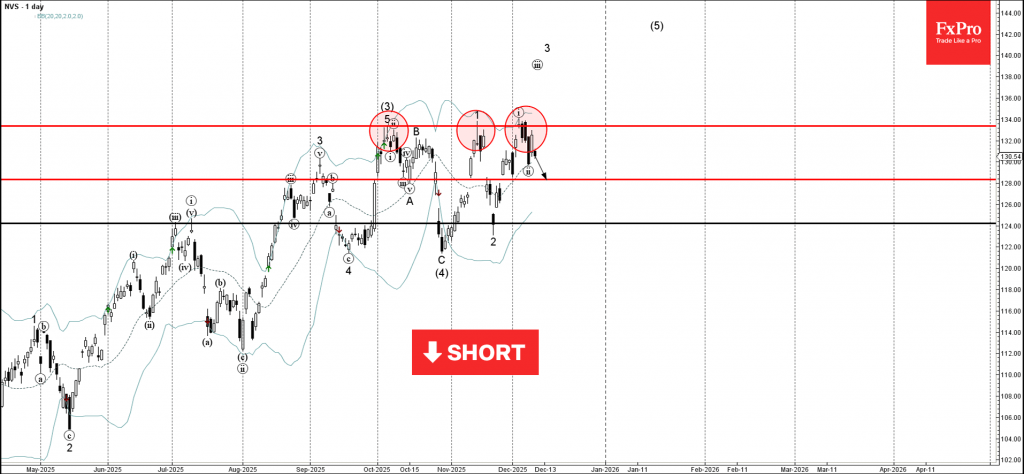
– Novartis reversed from strong resistance level 133.35

– Likely to fall to support level 128.00

Novartis recently reversed up from the resistance area between the strong resistance level 133.35 (which has been reversing the price from the start of October) and the upper daily Bollinger Band.

The downward reversal from this resistance zone stopped the previous minor impulse wave i from the end of November.

Given the strength of the resistance level 133.35, Novartis can be expected to fall to the next support level 128.00.

The FxPro Tech Analysis Team

The FxPro technical experts prepare a daily analysis of the most active currency pairs (majors, crosses, exotics) and commodities. Selected instruments are reviewed on daily trends (D1, H4), using the active Elliott Wave setups, Japanese candlesticks, indicators, and support/resistance levels.

Share
Published by
The FxPro Tech Analysis Team
Tags: Novartis

Recent Posts

Qualcomm Wave Analysis – 10 December 2025

Qualcomm: ⬆️ Buy - Qualcomm broke strong resistance level 177.00 - Likely to rise to resistance…

58 minutes ago

EURCHF Wave Analysis – 10 December 2025

EURCHF: ⬇️ Sell - EURCHF reversed from resistance area - Likely to fall to support…

3 hours ago

CHFJPY Wave Analysis – 10 December 2025

CHFJPY: ⬆️ Buy - CHFJPY reversed from pivotal support level 192.60 - Likely to rise…

3 hours ago

The FOMC will take another route

While some central banks are signals end of easing cycle, the Fed intends to continue.…

6 hours ago

The crypto market is trying to break the downtrend

The crypto market rebounds as Bitcoin surges, although volatility and regulatory changes loom; forecasts for…

7 hours ago

Ethereum Wave Analysis – 9 December 2025

Ethereum: ⬆️ Buy - Ethereum broke daily down channel - Likely to rise to resistance…

20 hours ago

This website uses cookies