Categories: Technical analysis

Novartis Wave Analysis – 03 April, 2020

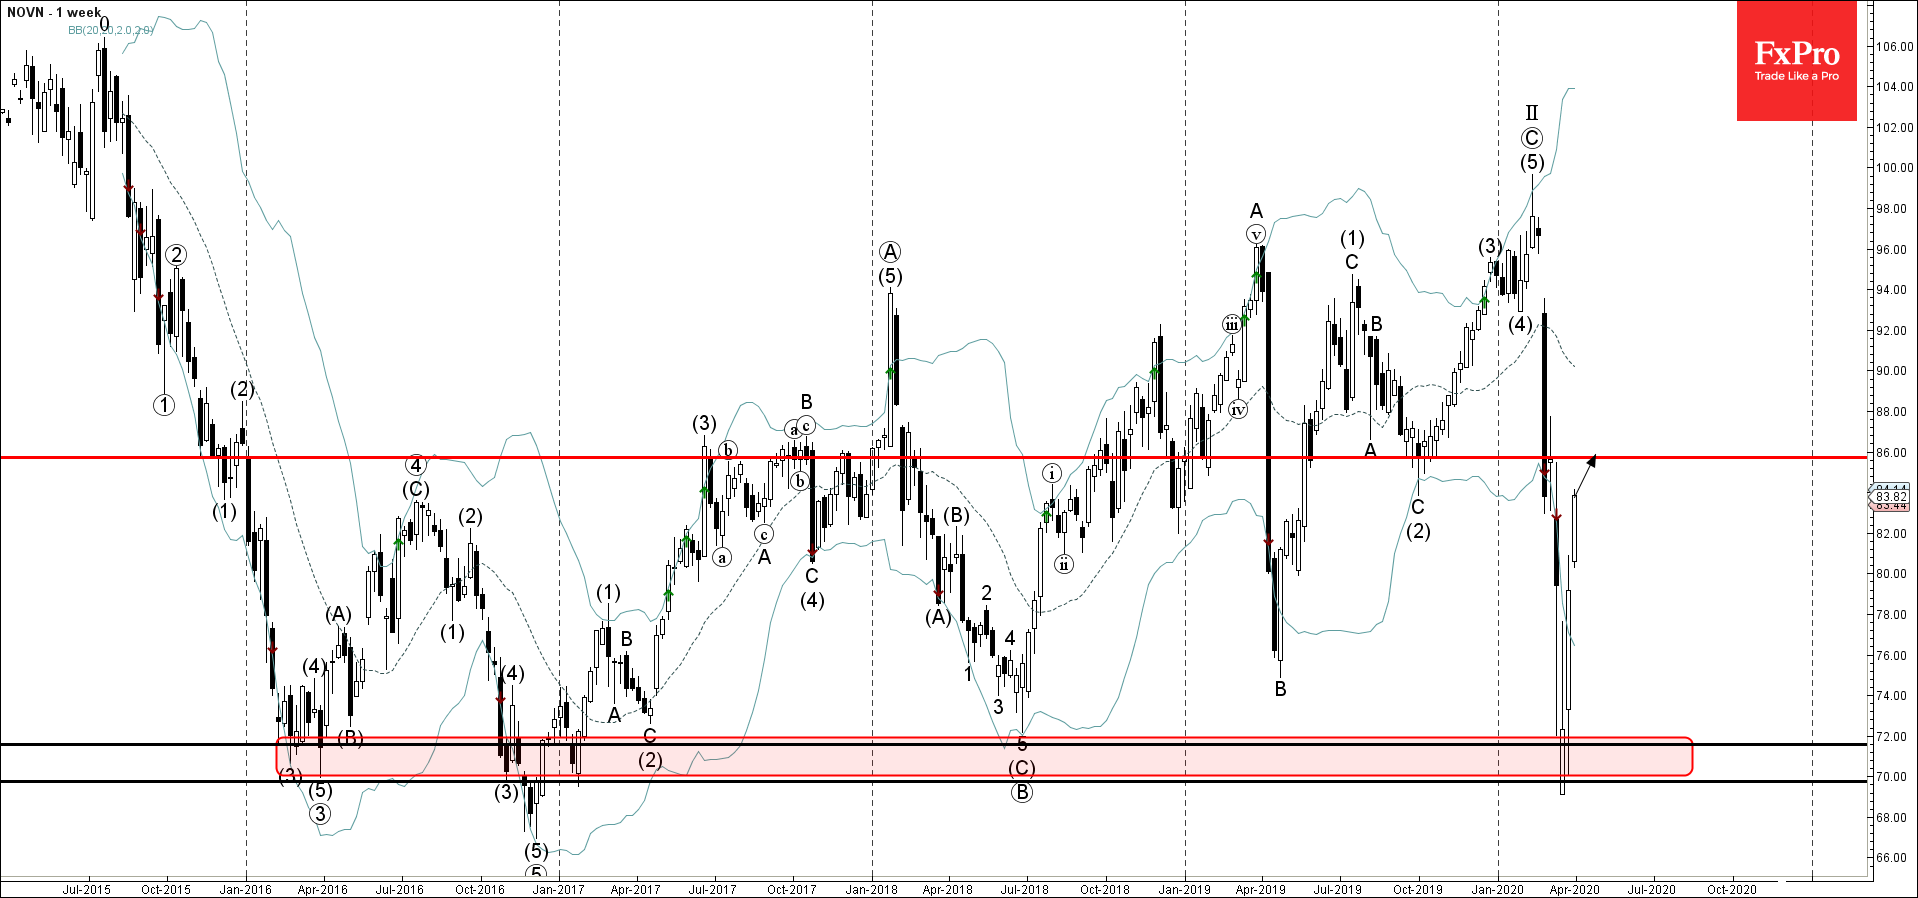
  • Novartis reversed from key support area
  • Likely to rise to 86.00

Novartis has been rising in the last few trading session after the earlier sharp upward reversal from the key support area lying between the long-term support levels 70.00 (former multi-month low fro 2016) and 72.00 (monthly low from 2018).

The upward reversal from this support area created the weekly reversal pattern Bullish Engulfing.

Novartis is likely to rise further toward the next resistance level 86.00 (former strong support from the middle of 2019).

AddThis Website Tools
The FxPro Tech Analysis Team

The FxPro technical experts prepare a daily analysis of the most active currency pairs (majors, crosses, exotics) and commodities. Selected instruments are reviewed on daily trends (D1, H4), using the active Elliott Wave setups, Japanese candlesticks, indicators, and support/resistance levels.

Share
Published by
The FxPro Tech Analysis Team
Tags: NOVN

Recent Posts

Gold Wave Analysis – 19 March 2025

Gold: ⬆️ Buy - Gold continues daily uptrend - Likely to rise to resistance level…

2 hours ago

EURJPY Wave Analysis – 19 March 2025

EURJPY: ⬇️ Sell - EURJPY reversed from resistance zone - Likely to fall to support…

2 hours ago

NZDUSD Wave Analysis – 19 March 2025

NZDUSD: ⬇️ Sell - NZDUSD reversed from the resistance level 0.5820 - Likely to fall…

10 hours ago

EURUSD Wave Analysis – 19 March 2025

EURUSD: ⬇️ Sell - EURUSD reversed from resistance level 1.0930 - Likely to fall to…

10 hours ago

Ethereum gives way

The crypto market remains in a downtrend, with Ethereum losing market share while Bitcoin's share…

15 hours ago

GBPUSD Wave Analysis – 18 March 2025

GBPUSD: ⬆️ Buy - GBPUSD reversed from support zone - Likely to rise to resistance…

1 day ago