Technical analysis

Nikkei 225 Wave Analysis – 5 January 2026

Nikkei 225: ⬆️ Buy

– Nikkei 225 broke resistance level 51160.00

– Likely to rise to resistance level 52860.00

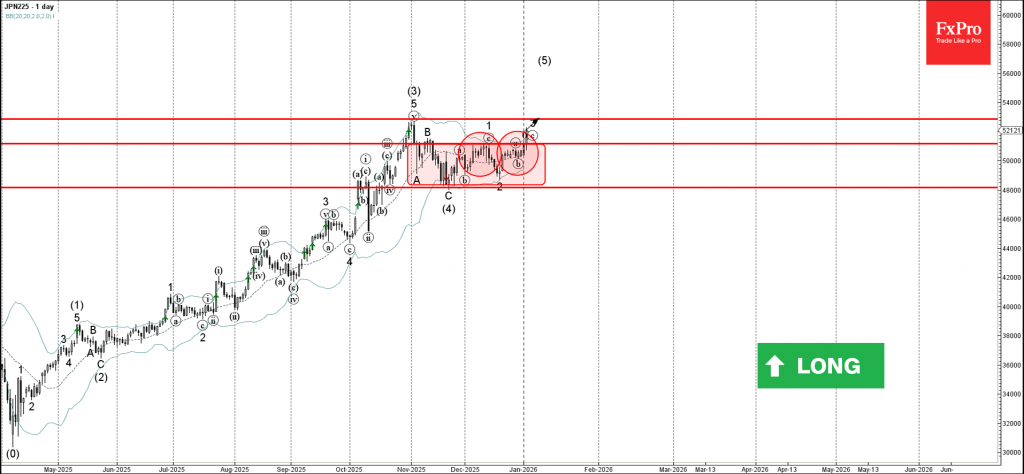
Nikkei 225 index recently broke above the resistance level 51160.00, which is the upper border of the sideways price range inside which the index has been moving from November.

The breakout of the resistance level 51160.00 accelerated the active impulse wave 3 – which belongs to the higher order impulse wave (5).

Given the strong daily uptrend, Nikkei 225 index can be expected to rise to the next resistance level 52860.00 (monthly high from November and the target for the completion of the active impulse wave 3).

The FxPro Tech Analysis Team

The FxPro technical experts prepare a daily analysis of the most active currency pairs (majors, crosses, exotics) and commodities. Selected instruments are reviewed on daily trends (D1, H4), using the active Elliott Wave setups, Japanese candlesticks, indicators, and support/resistance levels.

Share
Published by
The FxPro Tech Analysis Team
Tags: Nikkei 225

Recent Posts

Old fears about the euro have returned

The resurgence of the political crisis in France is weighing on EURUSD The US dollar…

5 hours ago

The crypto market has hit the upper limit of its rebound

The crypto market faces resistance at $3.2T; sentiment rises, but selling pressure persists. Bitcoin and…

7 hours ago

EURAUD Wave Analysis – 6 January 2026 Wave Analysis – 6 January 2026

EURAUD: ⬇️ Sell - EURAUD broke strong support level 1.7465 - Likely to fall to…

18 hours ago

IBM Wave Analysis – 6 January 2026

IBM: ⬆️ Buy - IBM reversed from support zone - Likely to rise to resistance…

18 hours ago

Palladium Wave Analysis – 6 January 2026

Palladium: ⬆️ Buy - Palladium reversed from round support level 1600.00 - Likely to rise…

18 hours ago

Amazon Wave Analysis – 6 January 2026

Amazon: ⬆️ Buy - Amazon broke resistance zone - Likely to rise to resistance level…

18 hours ago

This website uses cookies