Categories: Technical analysis

Nikkei 225 Wave Analysis – 24 February, 2020

  • Nikkei 225 broke key support level 22650.00
  • Likely to fall to 22000.00

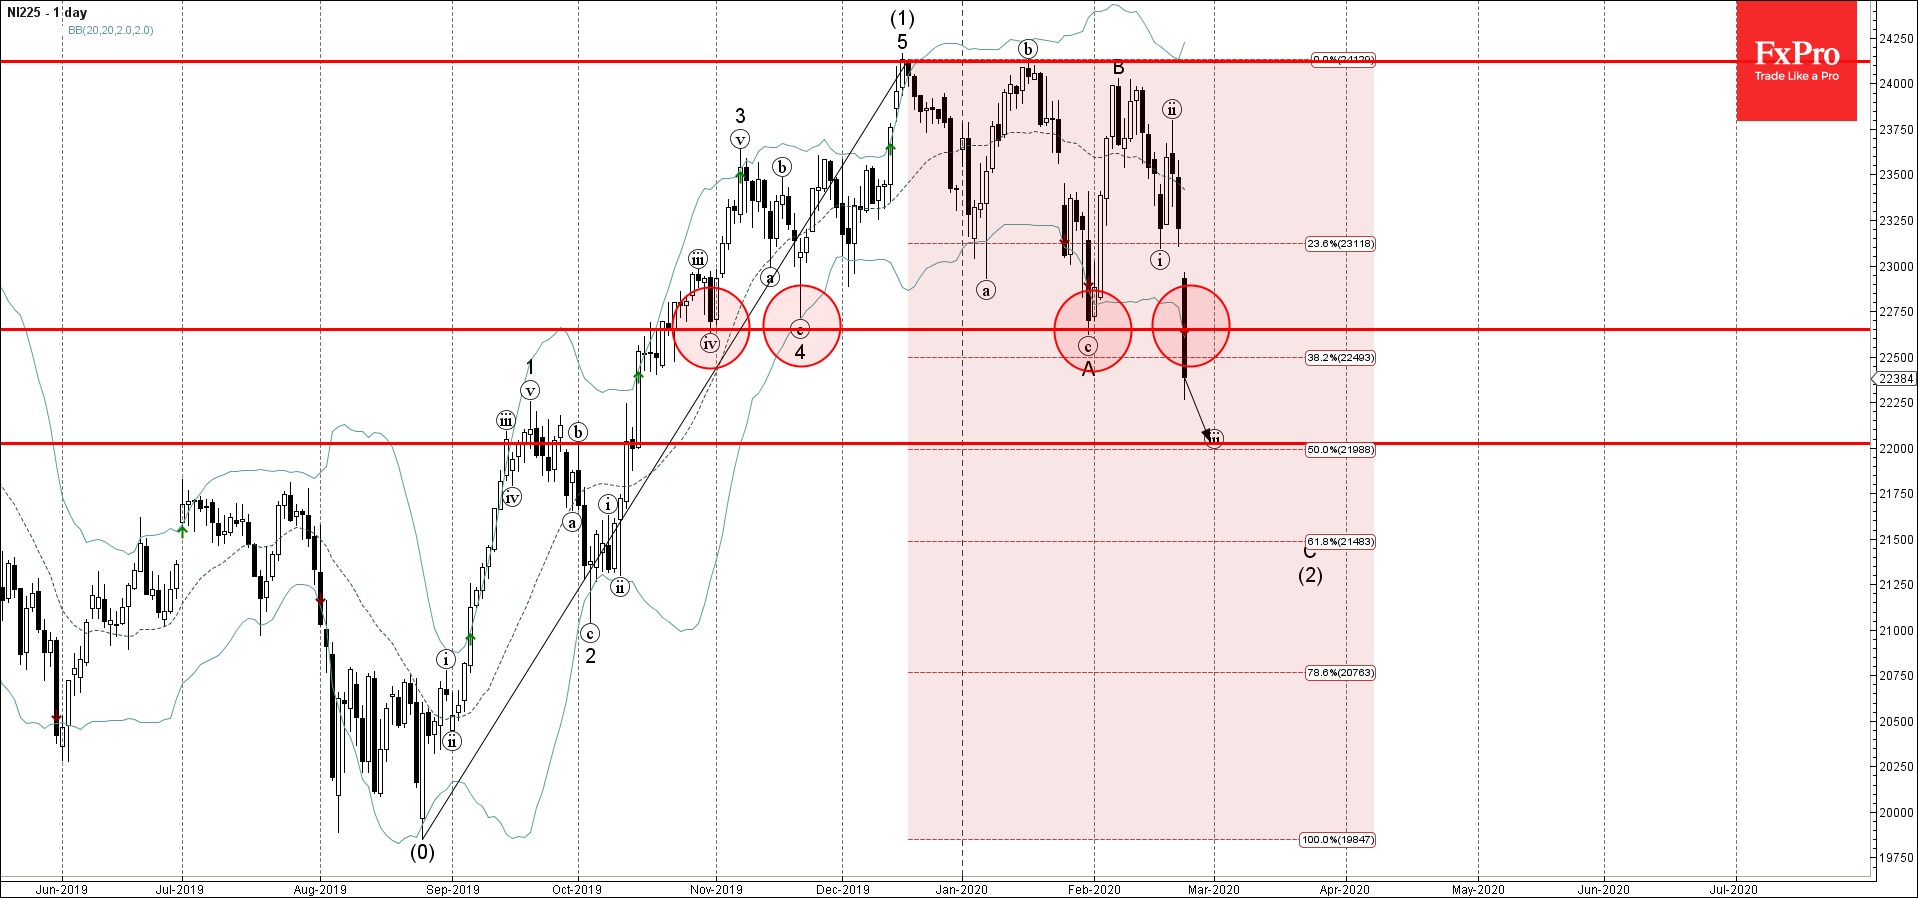
Nikkei 225 under bearish pressure after the earlier breakout of the support area located between the key support level 22650.00 (which has been reversing the price from October) and the 38.2% Fibonacci correction of the previous sharp upward impulse (1) from August.

The breakout of this support area should accelerate the active impulse wave C which belongs to the multi-week ABC correction (2) from December.

Nikkei 225 is likely to fall further toward the next support level 22000.00 (likely price for the completion of the active impulse wave (iii)).

AddThis Website Tools
The FxPro Tech Analysis Team

The FxPro technical experts prepare a daily analysis of the most active currency pairs (majors, crosses, exotics) and commodities. Selected instruments are reviewed on daily trends (D1, H4), using the active Elliott Wave setups, Japanese candlesticks, indicators, and support/resistance levels.

Share
Published by
The FxPro Tech Analysis Team
Tags: NI225

Recent Posts

Gold Wave Analysis – 19 March 2025

Gold: ⬆️ Buy - Gold continues daily uptrend - Likely to rise to resistance level…

2 hours ago

EURJPY Wave Analysis – 19 March 2025

EURJPY: ⬇️ Sell - EURJPY reversed from resistance zone - Likely to fall to support…

2 hours ago

NZDUSD Wave Analysis – 19 March 2025

NZDUSD: ⬇️ Sell - NZDUSD reversed from the resistance level 0.5820 - Likely to fall…

10 hours ago

EURUSD Wave Analysis – 19 March 2025

EURUSD: ⬇️ Sell - EURUSD reversed from resistance level 1.0930 - Likely to fall to…

10 hours ago

Ethereum gives way

The crypto market remains in a downtrend, with Ethereum losing market share while Bitcoin's share…

15 hours ago

GBPUSD Wave Analysis – 18 March 2025

GBPUSD: ⬆️ Buy - GBPUSD reversed from support zone - Likely to rise to resistance…

1 day ago