Categories: Technical analysis

Nikkei 225 Wave Analysis – 21 April 2023

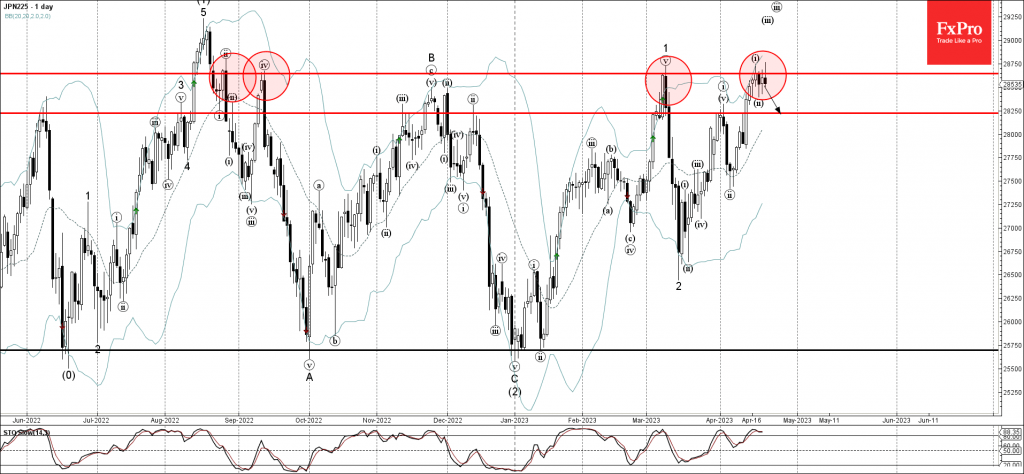
• Nikkei 225 reversed from resistance level 28645.00

• Likely to fall to support level 28250.00

Nikkei 225 index recently reversed down from the long-term resistance level 28645.00 (which has been steadily reversing the price from August of 2021).

The resistance level 28645.00 was strengthened by the upper daily Bollinger Band.

Given the strength of the resistance level 28645.00 and the overbought daily Stochastic, Nikkei 225 index can be expected to fall further toward the next support level 28250.00.

The FxPro Tech Analysis Team

The FxPro technical experts prepare a daily analysis of the most active currency pairs (majors, crosses, exotics) and commodities. Selected instruments are reviewed on daily trends (D1, H4), using the active Elliott Wave setups, Japanese candlesticks, indicators, and support/resistance levels.

Share
Published by
The FxPro Tech Analysis Team
Tags: nikkei225

Recent Posts

Bitcoin can’t accelerate but won’t give up trying 

Market picture  The crypto market capitalisation fell by 1.7% in 24 hours to $2.29 trillion,…

3 hours ago

USDJPY Wave Analysis 6 May 2024

- USDJPY reversed from support zone - Likely to rise to resistance level 155.65 USDJPY…

18 hours ago

Gold Wave Analysis 6 May 2024

- Gold reversed from support zone - Likely to rise to resistance level 2400.00 Gold…

18 hours ago

Oil Bounces Locally, Global Support 5% below Spot Price

The number of operating oil rigs in the US fell by 7 to 499. This…

22 hours ago

Crypto Market Tries to Break Local Downtrend

Market picture  Crypto market capitalisation has been up 2% over the past seven days and…

1 day ago

Adobe Wave Analysis 3 May 2024

- Adobe reversed from support zone - Likely to rise to resistance level 500.00 Adobe…

4 days ago

This website uses cookies