Categories: Technical analysis

Nikkei 225 Wave Analysis 19 March, 2021

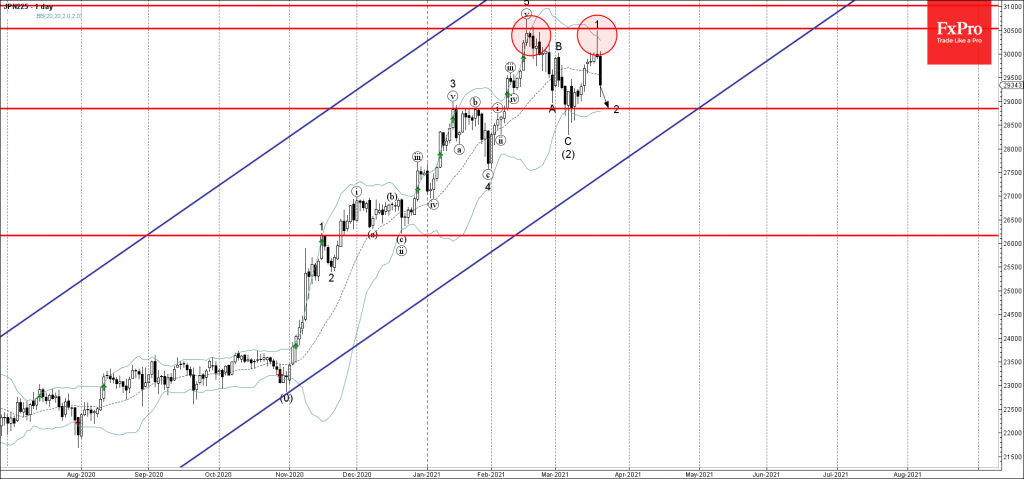
• Nikkei 225 falling inside minor corrective wave 2  

• Likely to reach support level 28850.00

Nikkei 225 index previously reversed down with the daily candlesticks reversal pattern Shooting Star Doji from the key resistance level 30500.00 – strengthened by the upper daily Bollinger Band.

The downward reversal from the resistance level 30500.00 started the active minor corrective wave 2.

Nikkei 225 index is likely to fall further toward the next support level 28850.00 (target price for the completion of the active wave 2).

The FxPro Tech Analysis Team

The FxPro technical experts prepare a daily analysis of the most active currency pairs (majors, crosses, exotics) and commodities. Selected instruments are reviewed on daily trends (D1, H4), using the active Elliott Wave setups, Japanese candlesticks, indicators, and support/resistance levels.

Share
Published by
The FxPro Tech Analysis Team
Tags: Nikkei 225

Recent Posts

The dollar does not tolerate dissent

US GDP growth is driven not by the White House, but by AI. The Bank…

55 minutes ago

The crypto market has made a breakthrough

The crypto market surges, hitting new highs, with bullish sentiment for Bitcoin and Ethereum amid…

1 hour ago

Brent Crude oil Wave Analysis – 13 January 2026

Brent Crude oil ⬆️ Buy - Brent Crude oil rising inside impulse wave c -…

15 hours ago

USDJPY Wave Analysis – 13 January 2026

USDJPY ⬆️ Buy - USDJPY broke resistance area - Likely to rise to resistance level…

15 hours ago

Exxon Mobil Wave Analysis – 13 January 2026

Exxon Mobil ⬆️ Buy - Exxon Mobil broke resistance level 125.60 - Likely to rise…

15 hours ago

BNB Wave Analysis – 13 January 2026

Brent Crude oil ⬆️ Buy - BNB broke out of sideways price range - Likely…

15 hours ago

This website uses cookies