Categories: Technical analysis

Nikkei 225 Wave Analysis – 12 August, 2022

• Nikkei 225 approaches key resistance level 28640.00

• Likely to correct down to support level 28400.00

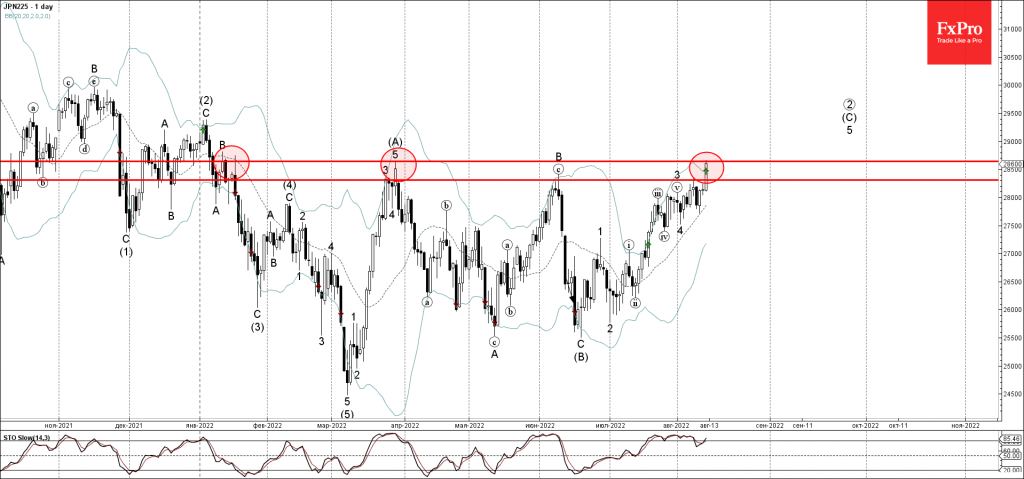
Nikkei 225 index today approached the key multi-month resistance level 28640.00, which stopped the sharp upward impulse wave (A) at the end of March, as can be seen below.

The resistance zone near the resistance level 28640.00 was strengthened by the upper daily Bollinger Band.

Given the strength of the resistance level 28640.00 and the overbought daily Stochastic, Nikkei 225 can be expected to correct down toward the next support level 28400.00 (previous monthly high from June). If the index breaks above 28640.00 – Nikkei 225 can then rise to the next resistance level 29000.00.

The FxPro Tech Analysis Team

The FxPro technical experts prepare a daily analysis of the most active currency pairs (majors, crosses, exotics) and commodities. Selected instruments are reviewed on daily trends (D1, H4), using the active Elliott Wave setups, Japanese candlesticks, indicators, and support/resistance levels.

Share
Published by
The FxPro Tech Analysis Team
Tags: nikkei225

Recent Posts

Adobe Wave Analysis 3 May 2024

- Adobe reversed from support zone - Likely to rise to resistance level 500.00 Adobe…

18 hours ago

EURGBP Wave Analysis 3 May 2024

- EURJPY reversed from support zone - Likely to rise to resistance level 0.8625 EURGBP…

18 hours ago

How Low Can the USDJPY Go?

USDJPY was slipping below 153 on Friday morning, a three-week low and having lost over…

1 day ago

Bitcoin’s Downtrend, Solana and Ethereum Form Double Bottom

Market picture  Crypto market capitalisation rose 3.3% in 24 hours to $2.22 trillion. Local capitalisation…

1 day ago

EURJPY Wave Analysis 2 May 2024

- EURJPY under strong bearish pressure - Likely to fall to support level 163.10 EURJPY…

2 days ago

WTI crude oil Wave Analysis 2 May 2024

- WTI broke round support level 80.00 - Likely to fall to support level 76.00…

2 days ago

This website uses cookies