Categories: Technical analysis

Nikkei 225 index Wave Analysis – 12 February 2025

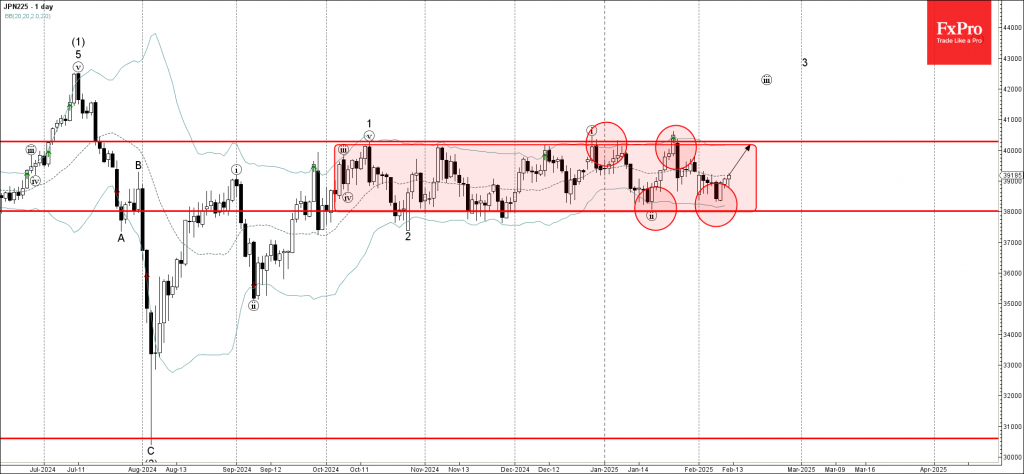
– Nikkei 225 index reversed support level 38000.00

– Likely to rise to resistance level 40285.00

Nikkei 225 index recently reversed up from the support level 38000.00, which is the lower border of the narrow sideways price range inside which the index has been moving from last October. This support area was strengthened by the lower daily Bollinger Band

The upward reversal from this support area created the daily Japanese candlesticks reversal pattern Piercing Line.

Given the clear daily uptrend, Nikkei 225 index can be expected to rise to the next resistance level 40285.00 (the upper border of this price range).

The FxPro Tech Analysis Team

The FxPro technical experts prepare a daily analysis of the most active currency pairs (majors, crosses, exotics) and commodities. Selected instruments are reviewed on daily trends (D1, H4), using the active Elliott Wave setups, Japanese candlesticks, indicators, and support/resistance levels.

Share
Published by
The FxPro Tech Analysis Team
Tags: Nikkei 225

Recent Posts

Platinum Wave Analysis – 8 January 2026

Platinum: ⬇️ Sell - Platinum reversed from pivotal resistance level 150.00 - Likely to fall to…

4 hours ago

Baidu Wave Analysis – 8 January 2026

Baidu: ⬇️ Sell - Baidu reversed from resistance zone - Likely to fall to support level…

4 hours ago

EURUSD Wave Analysis – 8 January 2026

EURUSD: ⬇️ Sell - EURUSD broke daily up channel - Likely to fall to support…

5 hours ago

WTI crude oil Wave Analysis – 8 January 2026

WTI crude oil: ⬆️ Buy - WTI crude oil reversed from support zone - Likely…

6 hours ago

Do not underestimate dollar

Positive macro statistics for the US are helping the greenback. Gold could rise to $4,610…

13 hours ago

Crypto fails to find support for a breakout

Crypto markets fell amid caution; Bitcoin and Ethereum face technical and investor shifts, with privacy…

13 hours ago

This website uses cookies