Categories: Technical analysis

Natural gas Wave Analysis – 7 July, 2020

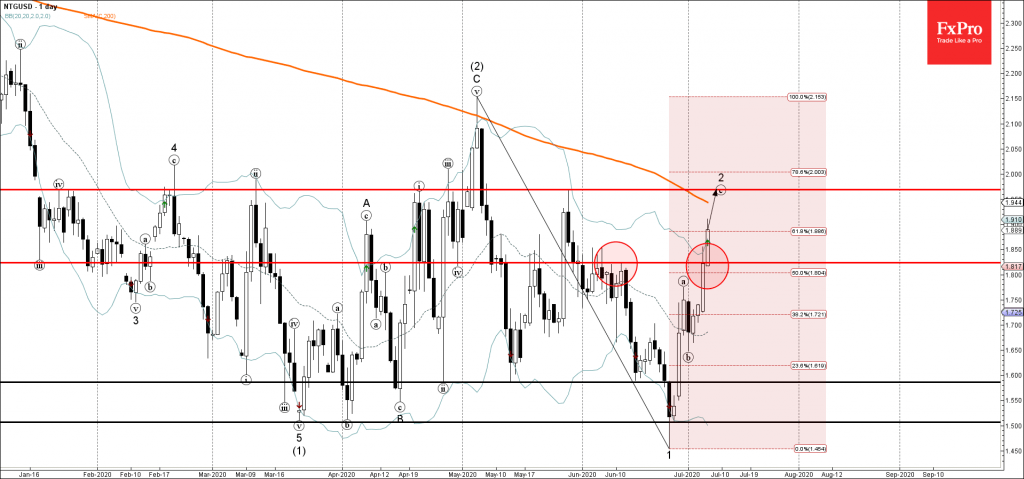
• Natural gas broke resistance level 1.824

• Likely to rise to 1.970

Natural gas recently broke above the key resistance level 1.824 (which reversed the price multiple times at the start of June).

The breakout of the resistance level 1.824 accelerated the active impulse wave (c) – which belongs to the ABC correction 2 from the round support level 1.500.                                                                                   Natural gas is likely to rise further toward the next resistance level 1.970 (former correction high from June and the forecast price for the completion of the active ABC correction 2).

The FxPro Tech Analysis Team

The FxPro technical experts prepare a daily analysis of the most active currency pairs (majors, crosses, exotics) and commodities. Selected instruments are reviewed on daily trends (D1, H4), using the active Elliott Wave setups, Japanese candlesticks, indicators, and support/resistance levels.

Share
Published by
The FxPro Tech Analysis Team
Tags: NTGUSD

Recent Posts

Crypto market shakes off consolidation

Market picture The release of US inflation data sparked a surge in risk asset purchases,…

10 hours ago

Gold Wave Analysis – 15 May, 2024

• Gold broke daily down channel • Likely to reach resistance level 2415.00 Gold recently…

1 day ago

AUDUSD Wave Analysis – 15 May, 2024

• AUDUSD broke key resistance level 0.6650 • Likely to reach resistance level 0.6760 AUDUSD…

1 day ago

EURUSD is trying to break the 5-month downtrend

The US dollar has been under relentless pressure since last Thursday, approaching more than one-month…

1 day ago

Matured altcoins are losing strength

Market Picture Neither the meme mania in equities, the overall positivity in stock indices, nor…

1 day ago

EURCHF Wave Analysis – 14 May, 2024

• EURCHF rising inside impulse wave 3 • Likely to reach resistance level 0.9835 EURCHF…

2 days ago

This website uses cookies