Categories: Technical analysis

Natural gas Wave Analysis 7 December, 2020

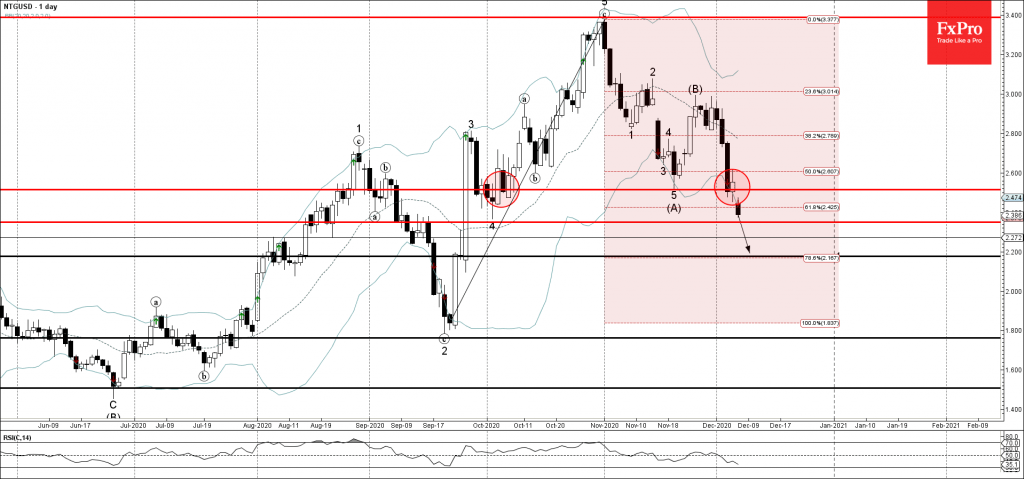
• Natural gas broke support level 2.515

• Likely to fall to 2.354

Natural gas continues to fall inside the sharp downward impulse wave (C) – which previously broke the key support level 2.515 (which stopped the (A)-wave in the middle of November).

The breakout of the support level 2.515 was preceded by the breakout of the 50% Fibonacci correction of the upward impulse from September.

Natural gas is expected to fall further toward the next support level 2.354 (monthly low from October) – followed by 2.200.\

The FxPro Tech Analysis Team

The FxPro technical experts prepare a daily analysis of the most active currency pairs (majors, crosses, exotics) and commodities. Selected instruments are reviewed on daily trends (D1, H4), using the active Elliott Wave setups, Japanese candlesticks, indicators, and support/resistance levels.

Share
Published by
The FxPro Tech Analysis Team
Tags: NTGUSD

Recent Posts

Crude Oil counteracts

Middle East tensions and Venezuelan supply shifts drive Brent crude volatility, with geopolitical risks and…

2 hours ago

Crypto market grows with risk appetite in stocks

Crypto market edges up as risk appetite returns; Bitcoin and Ethereum recover, despite investor caution…

3 hours ago

The yen returned to the Takaichi trade

The dollar resumed its growth after the lawsuit against the Fed chairman. Rumours of early…

4 hours ago

Nat Gas Current situation #tradelikeapro #trading #natgas #tradingstrategy #tradingshorts

Today is Tuesday, the 13th of January, and we will talk about the natural gas…

6 hours ago

Bitcoin Cash Wave Analysis – 12 January 2026

Bitcoin Cash: ⬇️ Sell - Bitcoin Cash reversed from resistance area - Likely to fall…

15 hours ago

EURJPY Wave Analysis – 12 January 2026

EURJPY: ⬆️ Buy - EURJPY reversed from support area - Likely to rise to resistance…

15 hours ago

This website uses cookies