Categories: Technical analysis

Natural gas Wave Analysis – 30 December, 2021

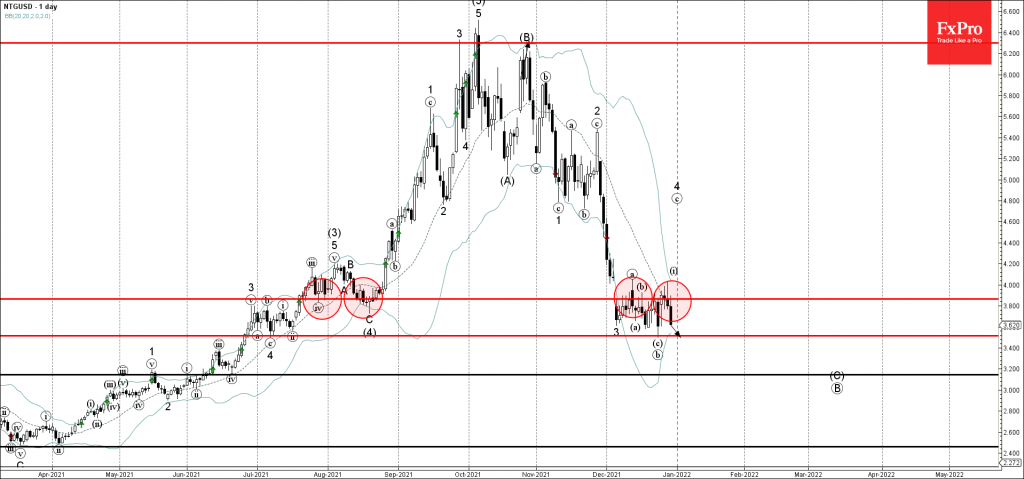
• Natural gas reversed from resistance level 3.865

• Likely to fall to support level 3.512

Natural gas recently reversed down from the strong resistance level 3.865 (former strong support from July and August, top of the earlier minor correction (a) from the start of December).

The resistance zone near the resistance level 3.865 was strengthened by the upper daily Bollinger Band.

Given the overriding daily downtrend – Natural gas can be expected to fall further toward the next support level 3.512 (former monthly low from July).

The FxPro Tech Analysis Team

The FxPro technical experts prepare a daily analysis of the most active currency pairs (majors, crosses, exotics) and commodities. Selected instruments are reviewed on daily trends (D1, H4), using the active Elliott Wave setups, Japanese candlesticks, indicators, and support/resistance levels.

Share
Published by
The FxPro Tech Analysis Team

Recent Posts

USDJPY Wave Analysis 26 April 2024

- USDJPY broke key resistance level 155.00 - Likely to rise to resistance level 160.00…

13 hours ago

Ebay Wave Analysis 26 April 2024

- Ebay reversed from support level 49.35 - Likely to rise to resistance level 52.55…

13 hours ago

False Alert with Yen Interventions?

Even though the Bank of Japan left the key rate and parameters of the QE…

22 hours ago

Cooler Bitcoin

Market picture  Market Dynamics: The cryptocurrency market stabilised, losing just 0.1% of capitalisation and dropping to…

1 day ago

GBPCAD Wave Analysis 25 April 2024

- GBPCAD reversed from key support level 1.6910 - Likely to rise to resistance level…

2 days ago

GBPAUD Wave Analysis 25 April 2024

- GBPAUD reversed from support level 1.9135 - Likely to rise to resistance level 1.9360…

2 days ago

This website uses cookies