Categories: Technical analysis

Natural gas Wave Analysis – 3 March, 2022

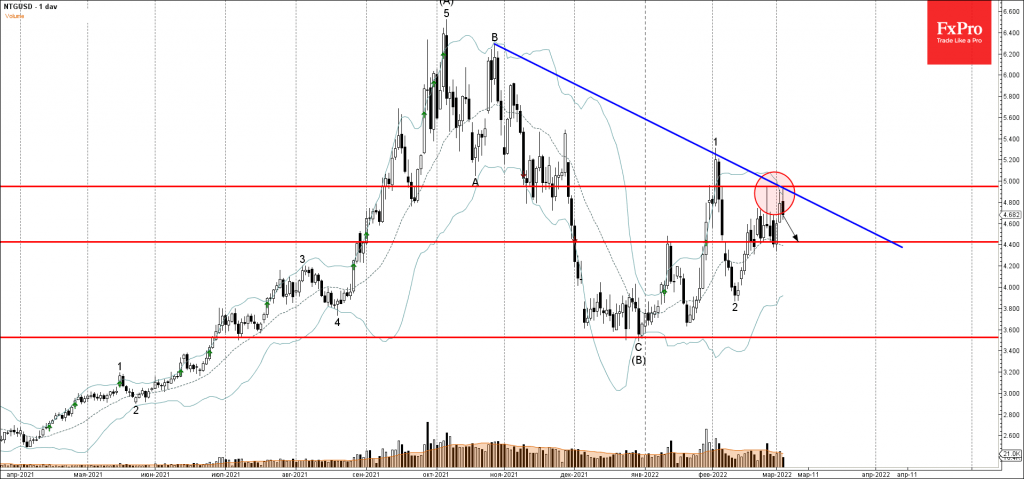
• Natural gas reversed from resistance level 5.000
• Likely to fall to support level 4.40

Natural gas recently reversed down from the key resistance level 5.000 (which has been reversing the pair from the end of January).

The resistance zone near the resistance level 5.000 was strengthened by the upper daily Bollinger Band and by the resistance trendline from last October.

Given the strength of the nearby resistance level 5.000 – Natural gas can be expected to fall further toward the next support level 4.40 (which has been reversing the price from the middle of February).

AddThis Website Tools
The FxPro Tech Analysis Team

The FxPro technical experts prepare a daily analysis of the most active currency pairs (majors, crosses, exotics) and commodities. Selected instruments are reviewed on daily trends (D1, H4), using the active Elliott Wave setups, Japanese candlesticks, indicators, and support/resistance levels.

Share
Published by
The FxPro Tech Analysis Team

Recent Posts

Video Pro News Weekly: Market Shake-Up. USD Struggles & Crypto’s Next Big Move!

Major market shifts underway! The US dollar hits resistance, stocks teeter on tariff tensions, and…

4 hours ago

Crypto’s dive

The crypto market has plunged, with a 1.3% drop in market capitalization in the last…

4 hours ago

AMD Wave Analysis – 28 March 2025

AMD: ⬇️ Sell - AMD reversed from pivotal resistance level 115.00 - Likely to fall…

3 days ago

Google Wave Analysis – 28 March 2025

Google: ⬇️ Sell - Google broke key support level 160.00 - Likely to fall to…

3 days ago

Gold Wave Analysis – 28 March 2025

Gold: ⬆️ Buy - Gold broke resistance level 3050.00 - Likely to rise to resistance…

3 days ago

Ethereum Wave Analysis – 28 March 2025

Ethereum: ⬇️ Sell - Ethereum reversed from the resistance level 2120.00 - Likely to fall…

3 days ago