Categories: Technical analysis

Natural gas Wave Analysis 29 November 2024

– Natural gas reversed from support zone

– Likely to rise to resistance level 3.550

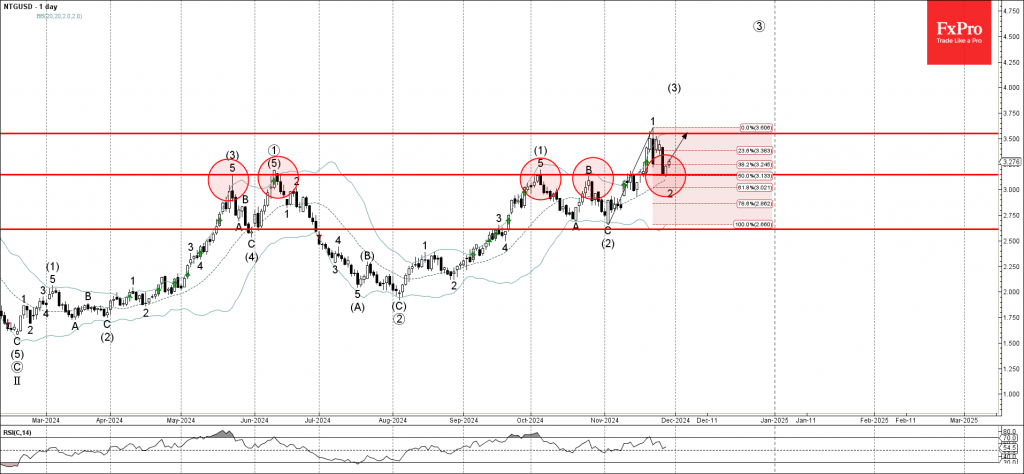
Natural gas recently reversed up from the support zone located between the support level 3.150 (former multi-month high from May, June and October), 20-day moving average and the 50% Fibonacci correction of the upward impulse 1 from the start of November.

The upward reversal from the support level 3.150 stopped the previous minor correction 2 – which belongs to wave (3) from the start of November.

Given the clear daily uptrend, Natural gas can be expected to rise to the next resistance level 3.550 (which stopped the previous sharp impulse wave 1 earlier this month).

The FxPro Tech Analysis Team

The FxPro technical experts prepare a daily analysis of the most active currency pairs (majors, crosses, exotics) and commodities. Selected instruments are reviewed on daily trends (D1, H4), using the active Elliott Wave setups, Japanese candlesticks, indicators, and support/resistance levels.

Share
Published by
The FxPro Tech Analysis Team
Tags: natural Gas

Recent Posts

CHFJPY Wave Analysis – 9 January 2026

CHFJPY: ⬆️ Buy - CHFJPY reversed from support area - Likely to rise to resistance…

1 day ago

Exxon Mobil Wave Analysis – 9 January 2026

Exxon Mobil: ⬆️ Buy - Exxon Mobil reversed from support area - Likely to rise…

1 day ago

Pro News Weekly: Dollar Rebounds as Markets Test New Limits

Welcome to Pro News Weekly! Here’s what is shaping the markets: 💵 The U.S. dollar…

1 day ago

Geopolitics will destroy the euro

•    EURUSD falls due to geopolitics and expectations of tariff removal •    Gold returns to…

2 days ago

Platinum Wave Analysis – 8 January 2026

Platinum: ⬇️ Sell - Platinum reversed from pivotal resistance level 150.00 - Likely to fall to…

2 days ago

Baidu Wave Analysis – 8 January 2026

Baidu: ⬇️ Sell - Baidu reversed from resistance zone - Likely to fall to support level…

2 days ago

This website uses cookies