Categories: Technical analysis

Natural gas Wave Analysis 27 June 2024

– Natural gas reversed from resistance zone

– Likely to fall to support level 2.6000

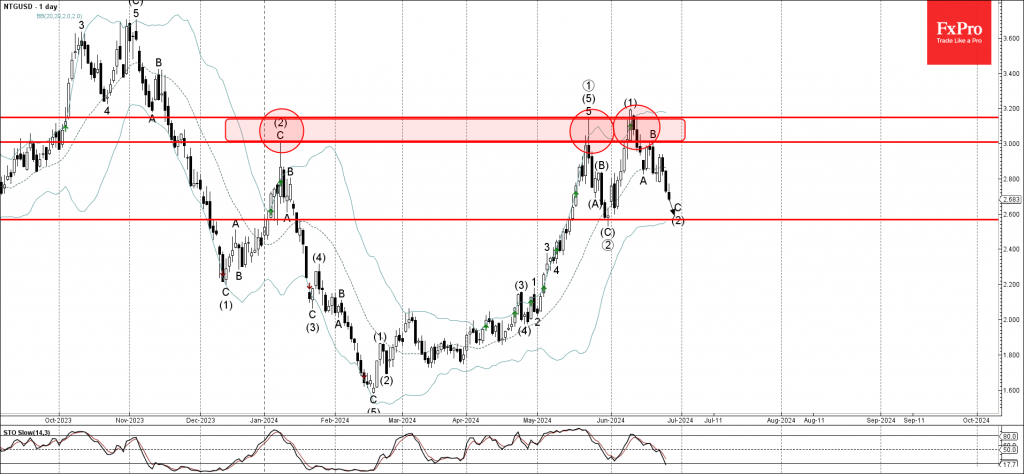
Natural gas recently reversed down from the resistance zone located between the resistance levels 3.200 and 3.0000, which have been reversing the price from the start this year, as can be seen below.

The aforementioned resistance zone was further strengthened by the upper daily Bollinger Band.

Natural gas can be expected to fall further to the next pivotal support 2.6000, target price for the completion of the active impulse wave C of the higher order ABC correction (2) from the start of June.

AddThis Website Tools
The FxPro Tech Analysis Team

The FxPro technical experts prepare a daily analysis of the most active currency pairs (majors, crosses, exotics) and commodities. Selected instruments are reviewed on daily trends (D1, H4), using the active Elliott Wave setups, Japanese candlesticks, indicators, and support/resistance levels.

Share
Published by
The FxPro Tech Analysis Team

Recent Posts

Apple Wave Analysis – 16 April 2025

Apple: ⬇️ Sell - Apple reversed from resistance level 210.00 - Likely to fall to…

6 hours ago

AUDCAD Wave Analysis – 16 April 2025

AUDCAD: ⬇️ Sell - AUDCAD reversed from resistance zone - Likely to fall to support…

6 hours ago

US sales jump gives USD relief, but is driven by fears

US Total retail sales rose 1.4% in March, beating the expected 1.3% after rising 0.2%…

13 hours ago

Tariff news and resistance zone put pressure on crypto

The crypto market capitalisation decreased by 2.6% in 24 hours due to the announcement of…

16 hours ago

Gold Wave Analysis – 16 April 2025

Gold: ⬆️ Buy - Gold broke resistance zone - Likely to rise to the resistance…

20 hours ago

GBPUSD Wave Analysis – 16 April 2025

GBPUSD: ⬆️ Buy - GBPUSD broke key resistance level 1.3200 - Likely to rise to…

20 hours ago