Categories: Technical analysis

Natural gas Wave Analysis – 27 August, 2020

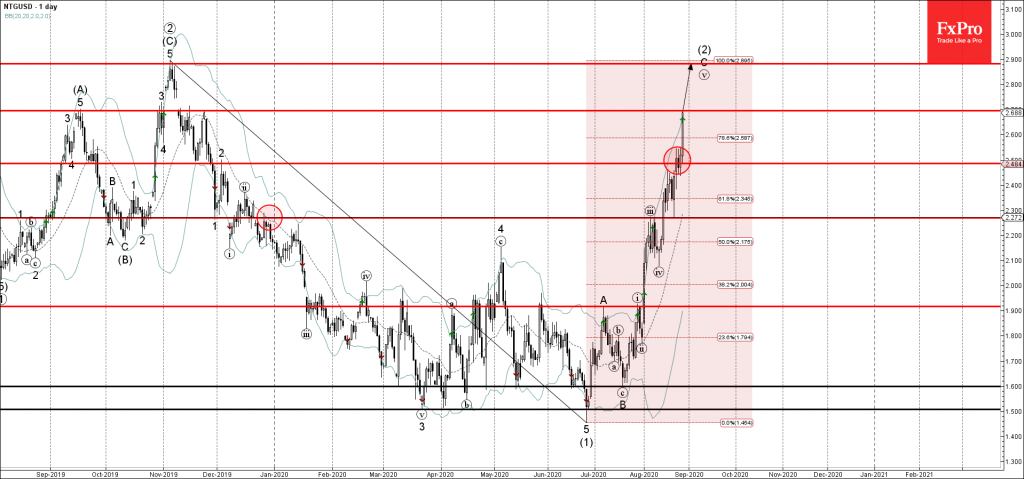
• Natural gas rising inside impulse wave C

• Likely to rise to 2,880

Natural gas continues to rise strongly inside the sharp upward impulse wave C – which belongs to the multi-month ABC correction (2) from the end of June.

The price is currently trading close to the key resistance level 2,70 (which reversed the price sharply in November of 2019).

If the price breaks above the resistance level 2,70 – Natural gas can then rise to the next major logn-term resistance level 2,880 (last November high and the target for the completion of wave (2)).

The FxPro Tech Analysis Team

The FxPro technical experts prepare a daily analysis of the most active currency pairs (majors, crosses, exotics) and commodities. Selected instruments are reviewed on daily trends (D1, H4), using the active Elliott Wave setups, Japanese candlesticks, indicators, and support/resistance levels.

Share
Published by
The FxPro Tech Analysis Team
Tags: NTGUSD

Recent Posts

AUDJPY Wave Analysis – 5 December 2025

AUDJPY: ⬆️ Buy - AUDJPY broke long-term resistance level 102.30 - Likely to rise to…

59 minutes ago

Aptos Wave Analysis – 5 December 2025

Aptos: ⬇️ Sell - Aptos testing major support at 1.688 - Likely to fall to…

60 minutes ago

Pro News Weekly: Market Shake-Up, Dollar Drops, Gold Surges, Bitcoin Wobbles!

Welcome to Pro News Flash! 💵 The U.S. dollar slips 🏆 Major stock indices struggle…

7 hours ago

Solana Wave Analysis – 5 December 2025

Solana: ⬇️ Sell - Solana reversed from resistance zone - Likely to fall to support…

8 hours ago

EURAUD Wave Analysis – 5 December 2025

EURAUD : ⬇️ Sell - EURAUD broke the support level 1.7600 - Likely to fall…

8 hours ago

Forex has set its priorities

In 2026, experts favour the yen, see modest euro growth, and expect pressure on the…

12 hours ago

This website uses cookies