- Natural Gas approached resistance zone
- Downward correction likely
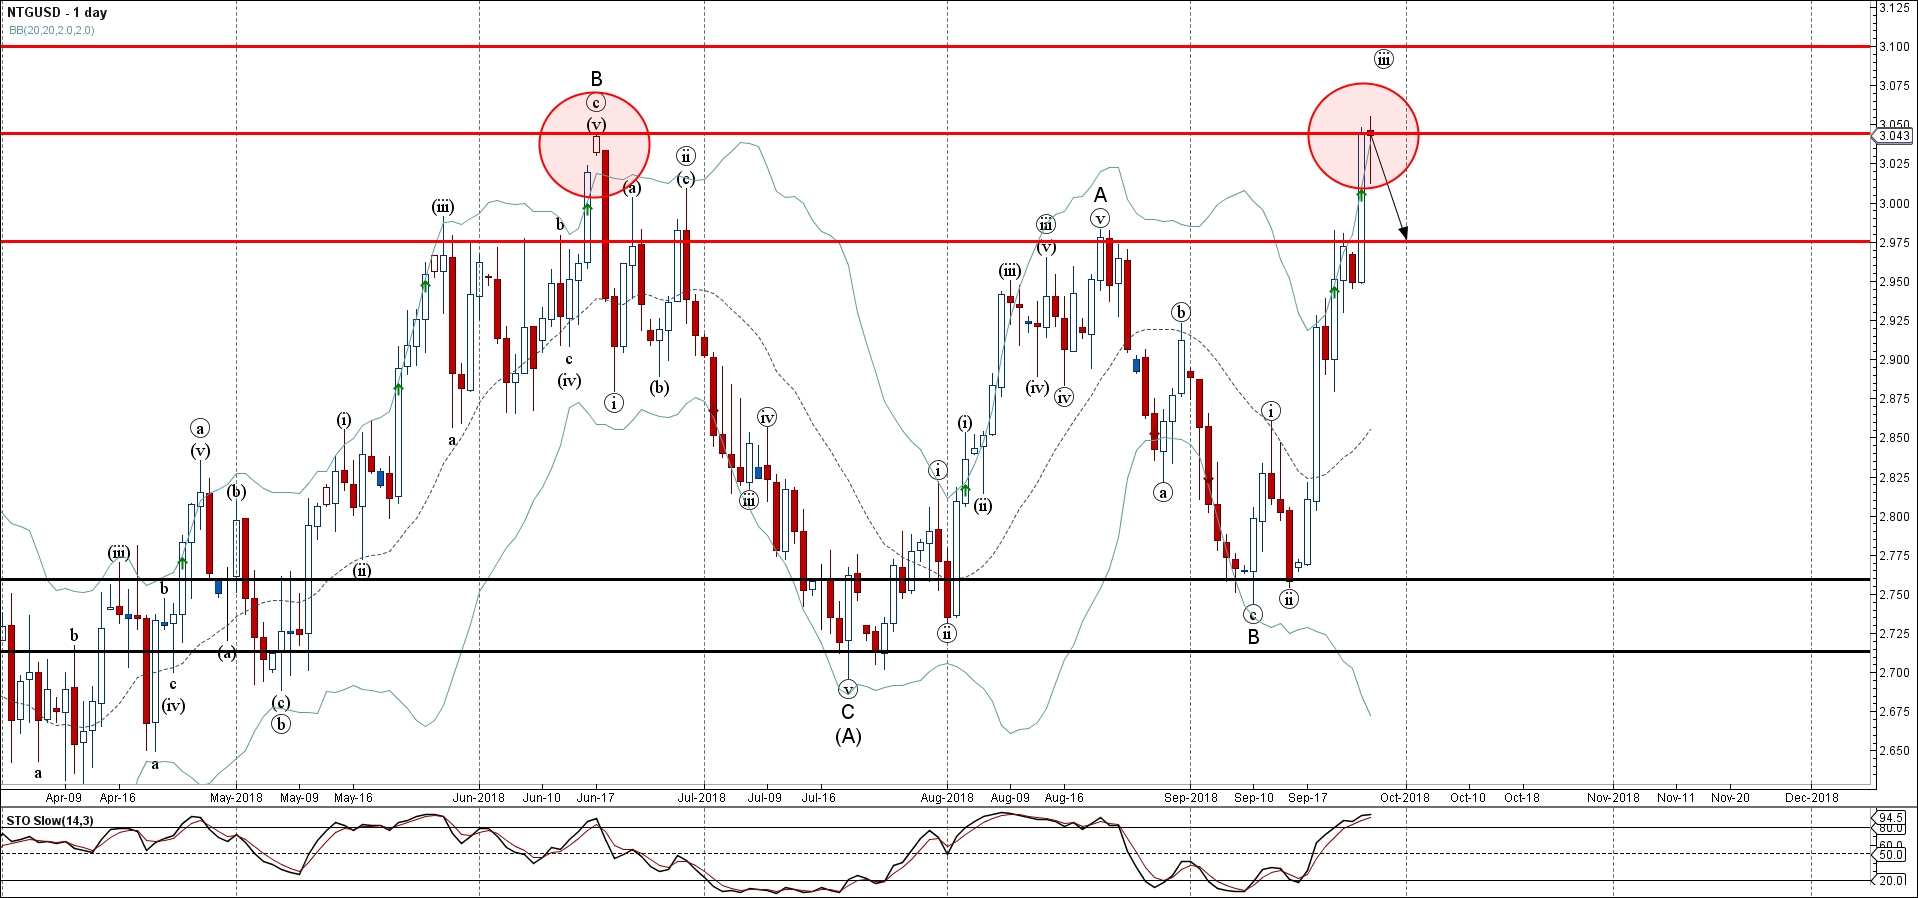
Natural Gas is currently trading close to the resistance zone lying between the long-term resistance level 3.0450 (which reversed the price with the daily Evening Star in June) and the upper daily Bollinger Band.
The price previously broke the key resistance level 2.975 (top of the previous wave A of the active ABC correction (B) from July).
Given the strength of the resistance level 3.0450 and the overbought daily Stochastic – Natural Gas is expected to correct down further and retest the aforementioned price level 2.975 (acting as support after it was broken). In the alternative scenario expect sharp gains toward the next resistance level 3.1000.