Categories: Technical analysis

Natural gas Wave Analysis – 25 October, 2021

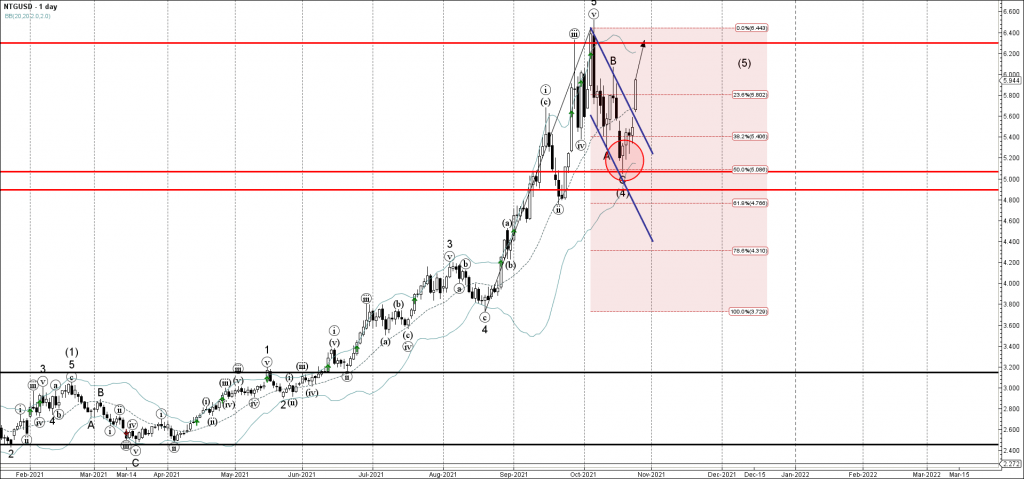
• Natural gas broke daily down channel

• Likely to rise to resistance level 6.3                                                                        


Natural gas continues to rises strongly after the price broke the daily down channel from the start of October (which enclosed the previous ABC correction (4)).

The breakout of this down channel accelerated the active medium-term impulse wave (5).

Given the sharp daily uptrend, Natural gas can be expected to rise further toward the next resistance level 6.3 (which stopped the previous impulse wave (iii) in September).

The FxPro Tech Analysis Team

The FxPro technical experts prepare a daily analysis of the most active currency pairs (majors, crosses, exotics) and commodities. Selected instruments are reviewed on daily trends (D1, H4), using the active Elliott Wave setups, Japanese candlesticks, indicators, and support/resistance levels.

Share
Published by
The FxPro Tech Analysis Team

Recent Posts

ADP hints at another strong NFP on Friday  

The monthly ADP labour market report showed that America created 192K new jobs in April, above…

13 hours ago

Fed’s hawkish tone risks sinking S&P500 to 4700

Bears showed strength ahead of the FOMC decision.  U.S. indices sagged on Tuesday as investors…

17 hours ago

A new stage of Bitcoin’s decline

Market Picture  Bitcoin's closing price on Tuesday became the lowest since late February, confirming the…

20 hours ago

Ebay Wave Analysis 30 April 2024

- Ebay under the bearish pressure - Likely to fall to support level 51.00 Ebay…

1 day ago

GBPAUD Wave Analysis 30 April 2024

- GBPAUD reversed from key support level 1.9135 - Likely to rise to resistance level…

1 day ago

Silver: a possible long road down

Silver has lost 2.6% since the start of the day on Tuesday to $26.4 per…

2 days ago

This website uses cookies