Categories: Technical analysis

Natural Gas Wave Analysis 23 October 2024

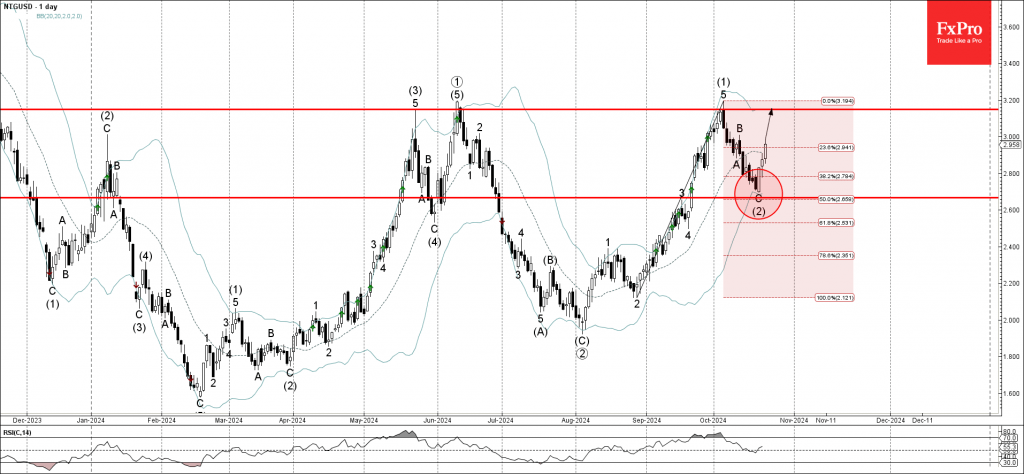
– Natural gas reversed from support zone

– Likely to rise to resistance level 3.150

Natural gas recently reversed up from the support zone between the support level 2.665 (former minor resistance from September) intersecting with the lower daily Bollinger Band and the 50% Fibonacci correction of the upward impulse from August.

The upward reversal from this support zone started the active medium-term impulse wave (3) – which belongs to the longer-term impulse wave 3.

Natural gas can be expected to rise toward the next resistance level 3.150 (which stopped the three earlier impulse waves (3), (5) and (1)).

The FxPro Tech Analysis Team

The FxPro technical experts prepare a daily analysis of the most active currency pairs (majors, crosses, exotics) and commodities. Selected instruments are reviewed on daily trends (D1, H4), using the active Elliott Wave setups, Japanese candlesticks, indicators, and support/resistance levels.

Share
Published by
The FxPro Tech Analysis Team

Recent Posts

How markets will react to the US election results

Market picture Polls and forecasts have yet to produce a clear frontrunner in the US…

4 hours ago

Bitcoin’s Rush to The Top

Market Picture Bitcoin came within a hair's breadth of an all-time high on Tuesday night,…

11 hours ago

Gold Wave Analysis 29 October 2024

- Gold broke resistance level 2750.00 - Likely to rise to resistance level 2800.00 Gold…

1 day ago

GBPAUD Wave Analysis 29 October 2024

- GBPAUD broke resistance zone - Likely to rise to resistance level 2.0000 GBPAUD currency…

1 day ago

Dollar Picks Its Way

The Dollar Index stabilised in the 0.5% range for the fifth session, quietly finding its…

1 day ago

Bitcoin’s Bullish Breakout

Market Picture The crypto market cap rose by 4.7% to $2.4 trillion in the last…

1 day ago

This website uses cookies