Categories: Technical analysis

Natural gas Wave Analysis – 23 November, 2022

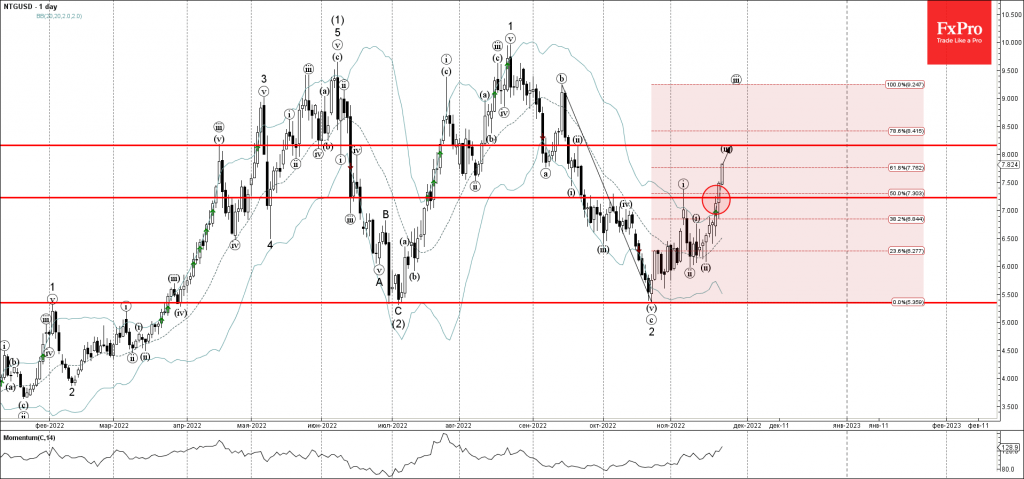
• Natural gas broke resistance level 7.230

• Likely to rise to resistance level 8.160

Natural gas recently broke above the resistance level 7.230 (which has been reversing the price from the start of October), intersecting with the 50% Fibonacci correction of the downward impulse from September.

The breakout of the resistance level 7.230 accelerated the active short-term impulse wave (iii).

Natural gas can be expected to rise further toward the next resistance level 8.160 (top of wave (ii) from the end of September and the target for the completion of the active impulse wave (iii)).

The FxPro Tech Analysis Team

The FxPro technical experts prepare a daily analysis of the most active currency pairs (majors, crosses, exotics) and commodities. Selected instruments are reviewed on daily trends (D1, H4), using the active Elliott Wave setups, Japanese candlesticks, indicators, and support/resistance levels.

Share
Published by
The FxPro Tech Analysis Team

Recent Posts

The crypto market slides down

The crypto market experienced a significant decline, with a market capitalization of $2.35 trillion and…

1 hour ago

Nikkei 225 Wave Analysis – 4 April 2025

Nikkei 225: ⬇️ Sell - Nikkei 225 broke support zone - Likely to fall to…

3 days ago

Gold Wave Analysis – 4 April 2025

Gold: ⬇️ Sell - Gold broke daily up channel - Likely to fall to support…

3 days ago

Video Pro News Weekly

The U.S. dollar takes a major hit as trade tariffs spark capital flight, while global…

3 days ago

Mad Gold and Crude Oil

Gold experienced a significant increase followed by a sharp decline. It may be a good…

3 days ago

The US index’s demise has accelerated after confirming the downtrend

US indices fell after tough tariffs were announced by Trump, triggering a negative reaction in…

3 days ago

This website uses cookies