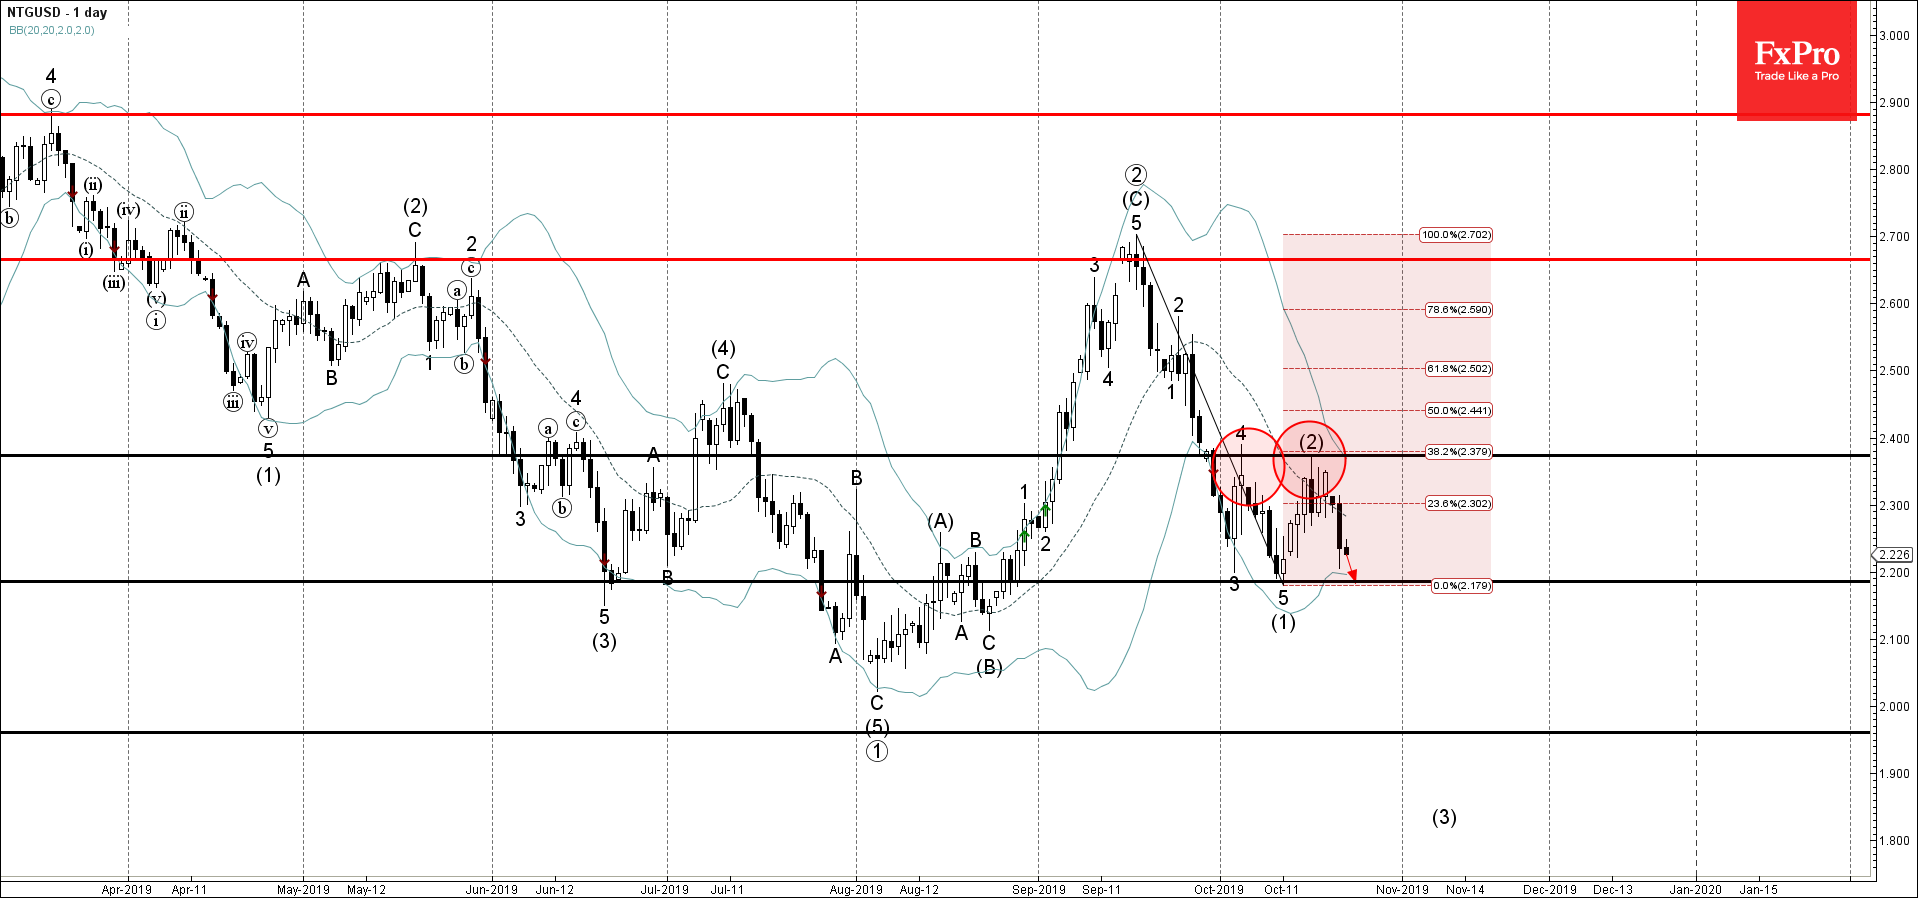
- Natural Gas falling inside impulse wave (3)
- Likely to fall to 2.200
Natural Gas continues to fall inside the medium-term impulse wave (3) – which started recently from the resistance zone lying between the resistance level 2.375 (top of wave 4), upper daily Bollinger Band and the 38.2% Fibonacci correction of the previous downward impulse (1) from September.
The active impulse wave (3) belongs to the long-term downward impulse sequence.
Natural Gas is expected to fall further and retest the next support level 2.200 (low of the previous strong impulse wave (1)).