Categories: Technical analysis

Natural gas Wave Analysis 21 September, 2020

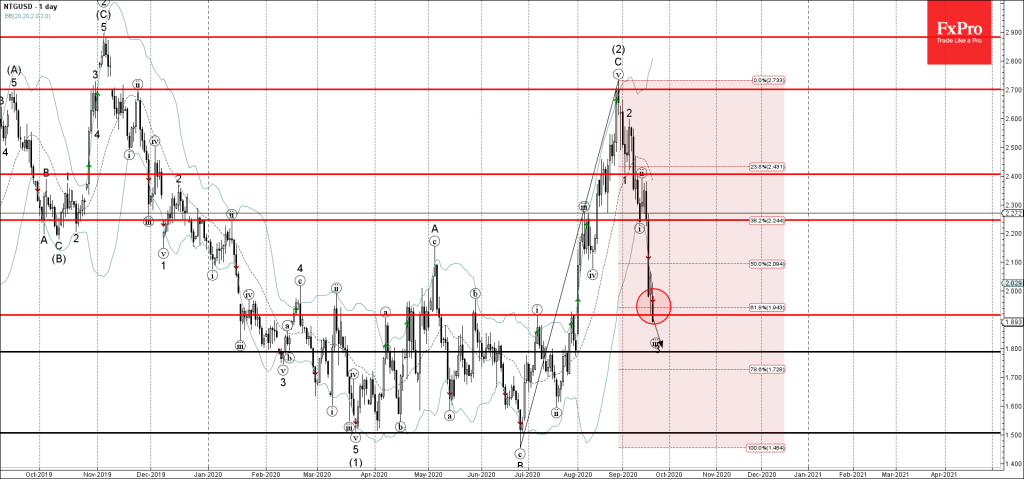
• Natural gas broke support zone

• Likely to fall to 1.800

Natural gas today broke the support zone set between the support level 1.92 (former resistance from July) and the 61.8% Fibonacci correction of the sharp upward impulse C from July.

The breakout of this support zone is likely to accelerate the active impulse waves (iii) and 3 – which belong to wave (3) from last month.

Natural gas is expected to fall further toward the next support level 1.800 (target price for the termination of the active impulse waves (iii) and 3).

The FxPro Tech Analysis Team

The FxPro technical experts prepare a daily analysis of the most active currency pairs (majors, crosses, exotics) and commodities. Selected instruments are reviewed on daily trends (D1, H4), using the active Elliott Wave setups, Japanese candlesticks, indicators, and support/resistance levels.

Share
Published by
The FxPro Tech Analysis Team
Tags: NTGUSD

Recent Posts

JPMorgan Chase Wave Analysis – 18 December 2025

JPMorgan Chase: ⬇️ Sell - JPMorgan Chase reversed from resistance area - Likely to fall…

8 hours ago

EURUSD Wave Analysis – 18 December 2025

EURUSD: ⬇️ Sell - EURUSD reversed from resistance area - Likely to fall to support level…

8 hours ago

AUDJPY Wave Analysis – 18 December 2025

AUDJPY: ⬆️ Buy - AUDJPY reversed from support area - Likely to rise to resistance…

9 hours ago

Palladium Wave Analysis – 18 December 2025

Palladium: ⬆️ Buy - Palladium broke multi-month resistance level 1600.00 - Likely to rise to resistance…

9 hours ago

GBPUSD. Current situation #tradelikeapro #trading #tradingstrategy #tradingshorts #gbpusd #gbp

Today is Thursday, the 18th of December, and we'll be talking about the British pound…

15 hours ago

Bitcoin is holding, while Solana is on the edge

Bitcoin remains stable near $87K, outperforming altcoins, while Solana faces key support at $120. Institutional…

16 hours ago

This website uses cookies