Categories: Technical analysis

Natural gas Wave Analysis 21 October, 2020

• Natural gas broke resistance area

• Likely to reach 3.100

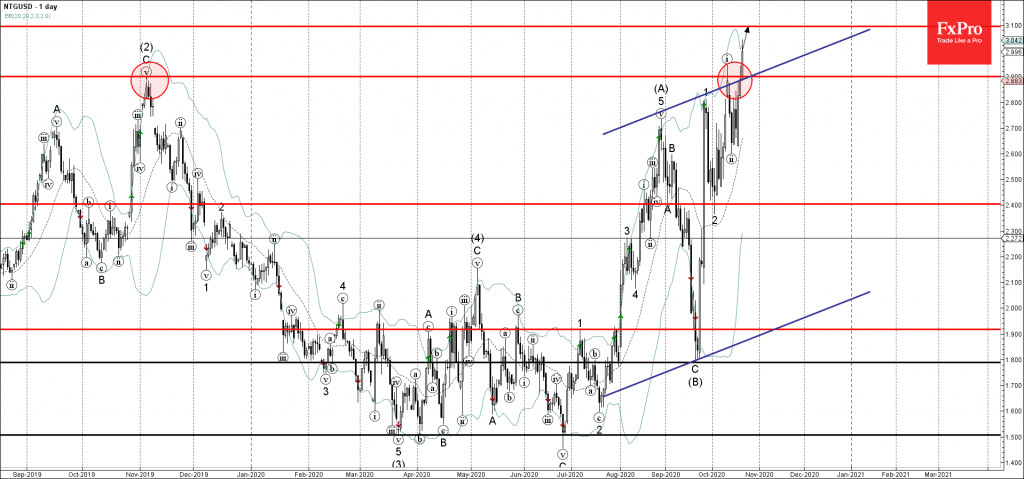
Natural gas recently broke above the resistance area located at the intersection of the multi-month resistance level 2.900 and the resistance trendline of the daily up channel from July.                                                

The breakout of this resistance area continues the active impulse wave (iii) of the sharp upward impulse sequence (C) from September.

Natural gas is likely to rise further toward the next resistance level 3.100 – the breakout of which will lead to further gains toward 3.200.

The FxPro Tech Analysis Team

The FxPro technical experts prepare a daily analysis of the most active currency pairs (majors, crosses, exotics) and commodities. Selected instruments are reviewed on daily trends (D1, H4), using the active Elliott Wave setups, Japanese candlesticks, indicators, and support/resistance levels.

Share
Published by
The FxPro Tech Analysis Team
Tags: NTGUSD

Recent Posts

Bitcoin is holding, while Solana is on the edge

Bitcoin remains stable near $87K, outperforming altcoins, while Solana faces key support at $120. Institutional…

2 hours ago

The dollar’s wings have been clipped

Waller's dovish rhetoric halted the bears' attack on EURUSD. Slowing UK inflation caused the pound…

2 hours ago

Dow Jones Wave Analysis – 17 December 2025

Dow Jones: ⬇️ Sell - Dow Jones reversed from resistance level 49000.00 - Likely to fall…

18 hours ago

Comcast Wave Analysis – 17 December 2025

Comcast: ⬆️ Buy - Comcast broke resistance area - Likely to rise to resistance level 31.00…

18 hours ago

Platinum Wave Analysis – 17 December 2025

Platinum: ⬆️ Buy - Platinum broke resistance level 1800.00 - Likely to rise to resistance…

19 hours ago

Silver Wave Analysis – 17 December 2025

Silver: ⬆️ Buy - Silver broke resistance zone - Likely to rise to resistance level…

19 hours ago

This website uses cookies