Categories: Technical analysis

Natural gas Wave Analysis – 20 July, 2020

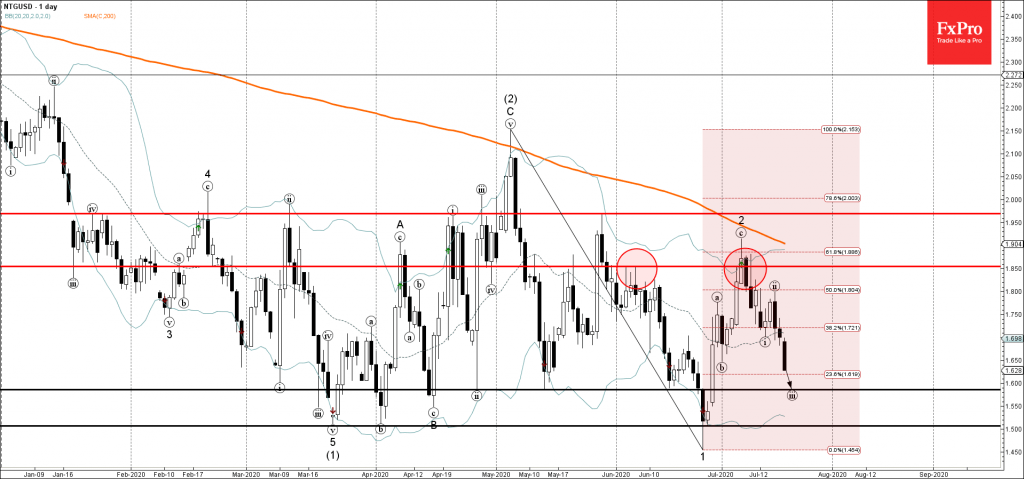
• Natural gas falling inside impulse wave (iii)

• Likely to reach 1.600

Natural gas continues to fall inside the short-term impulse wave (iii) – which belongs to longer-term impulse sequence 3 from the start of July.

The price earlier broke below the support level 1.650 (low of the (b) of the previous sharp ABC correction 2 from last month) – which accelerated the active wave 3.

Natural gas is likely to fall further toward the next support level 1.600 (target price for the completion of the active minor impulse wave (iii)).

The FxPro Tech Analysis Team

The FxPro technical experts prepare a daily analysis of the most active currency pairs (majors, crosses, exotics) and commodities. Selected instruments are reviewed on daily trends (D1, H4), using the active Elliott Wave setups, Japanese candlesticks, indicators, and support/resistance levels.

Share
Published by
The FxPro Tech Analysis Team
Tags: NTGUSD

Recent Posts

Bitcoin can’t accelerate but won’t give up trying 

Market picture  The crypto market capitalisation fell by 1.7% in 24 hours to $2.29 trillion,…

18 mins ago

USDJPY Wave Analysis 6 May 2024

- USDJPY reversed from support zone - Likely to rise to resistance level 155.65 USDJPY…

15 hours ago

Gold Wave Analysis 6 May 2024

- Gold reversed from support zone - Likely to rise to resistance level 2400.00 Gold…

15 hours ago

Oil Bounces Locally, Global Support 5% below Spot Price

The number of operating oil rigs in the US fell by 7 to 499. This…

19 hours ago

Crypto Market Tries to Break Local Downtrend

Market picture  Crypto market capitalisation has been up 2% over the past seven days and…

1 day ago

Adobe Wave Analysis 3 May 2024

- Adobe reversed from support zone - Likely to rise to resistance level 500.00 Adobe…

4 days ago

This website uses cookies